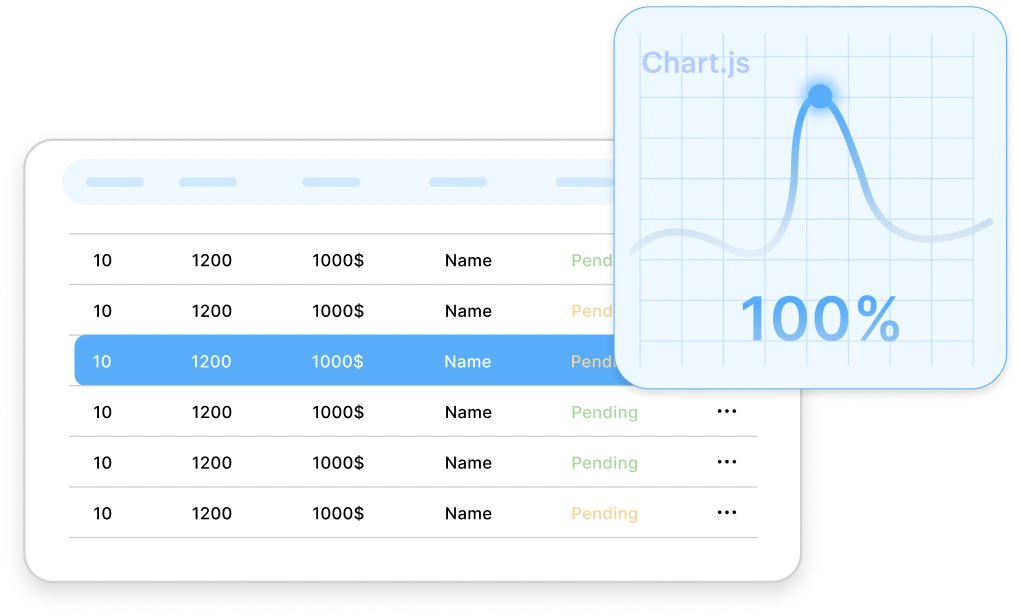
Don't just show data. Tell a Story.
Transform complex WordPress tables into stunning, interactive charts and graphs. 80+ chart types, 5 powerful engines, zero coding.
Start Visualizing Your Data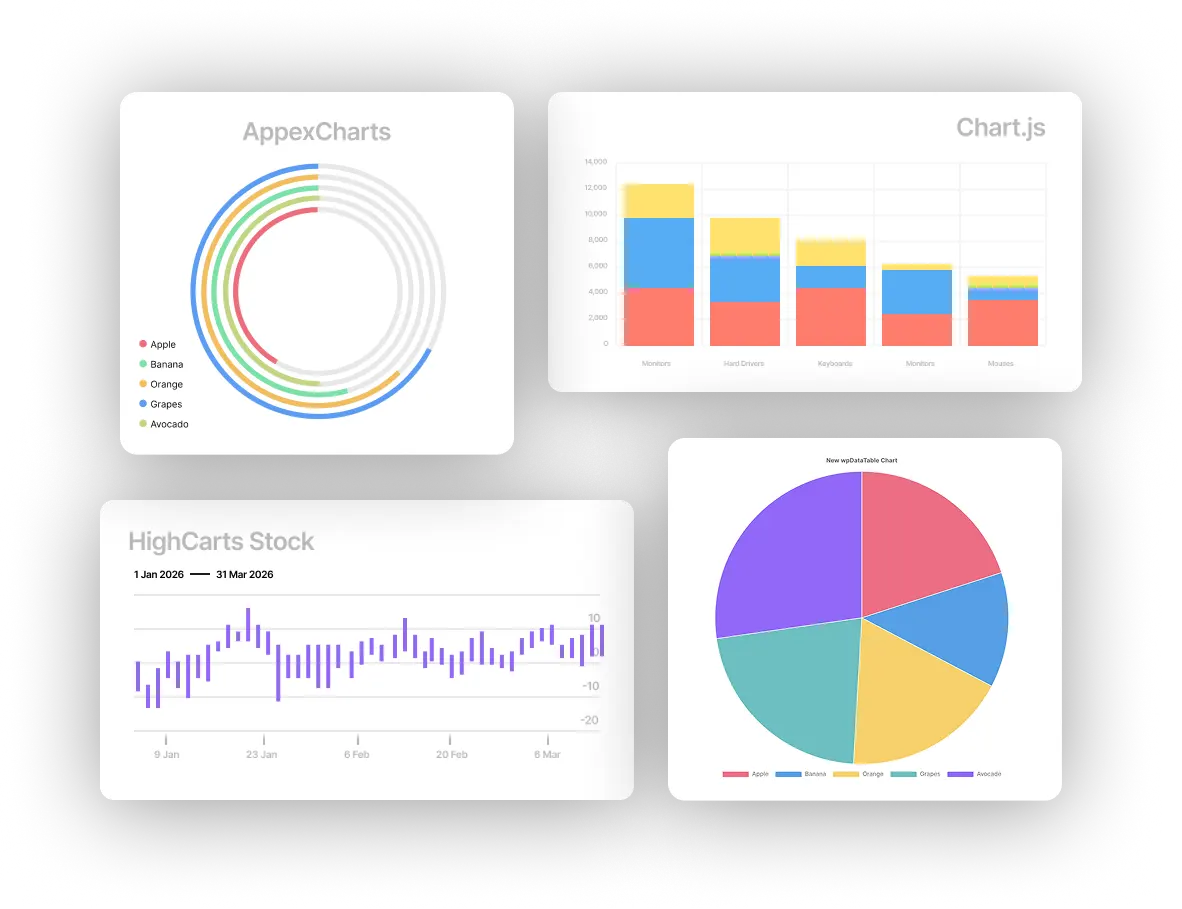
Choose your engine
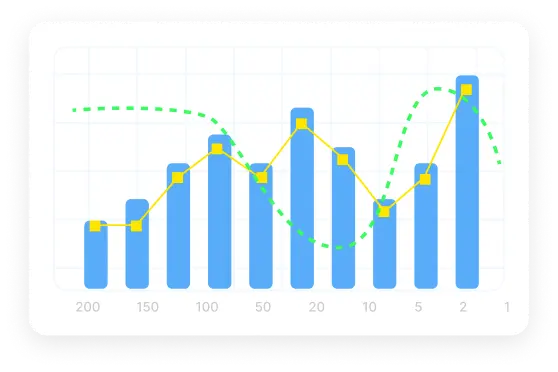
Highcharts
Built for advanced analytics and financial-grade data visualization.

Google Charts
Reliable, widely trusted, and perfect for business reports & dashboards.
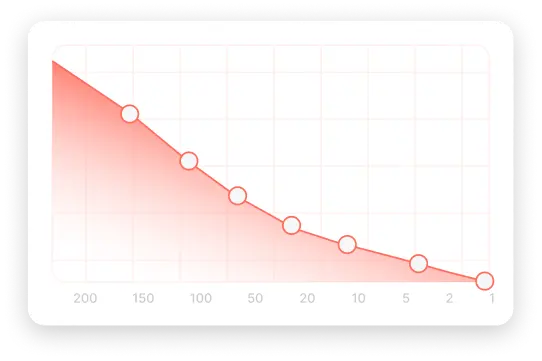
Chart.js
Modern, lightweight, and beautifully animated.
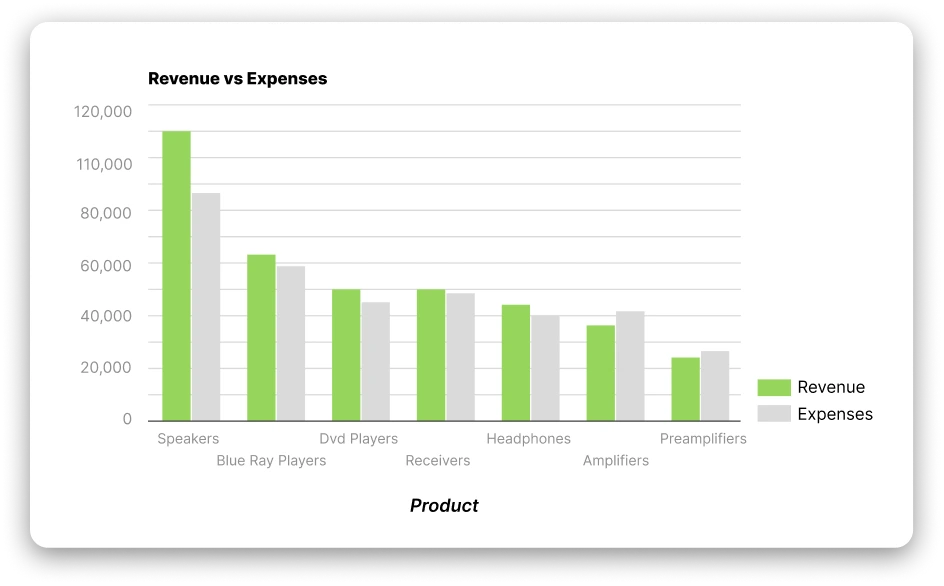
Create powerful dashboards from your data
Charts are powerful, but dashboards turn data into real insights.
By combining interactive tables and charts, wpDataTables lets you build complete dashboards that help teams understand trends, monitor performance, and make smarter decisions.
Bring your data together in one place and turn numbers into actionable insights.
Mobile-first design
Every chart created with wpDataTables is fully responsive by default. Whether your visitors are viewing data on a smartphone, tablet, laptop, or a 4K monitor, the visualizations will automatically adapt to deliver the best possible experience.
Start Visualizing Your Data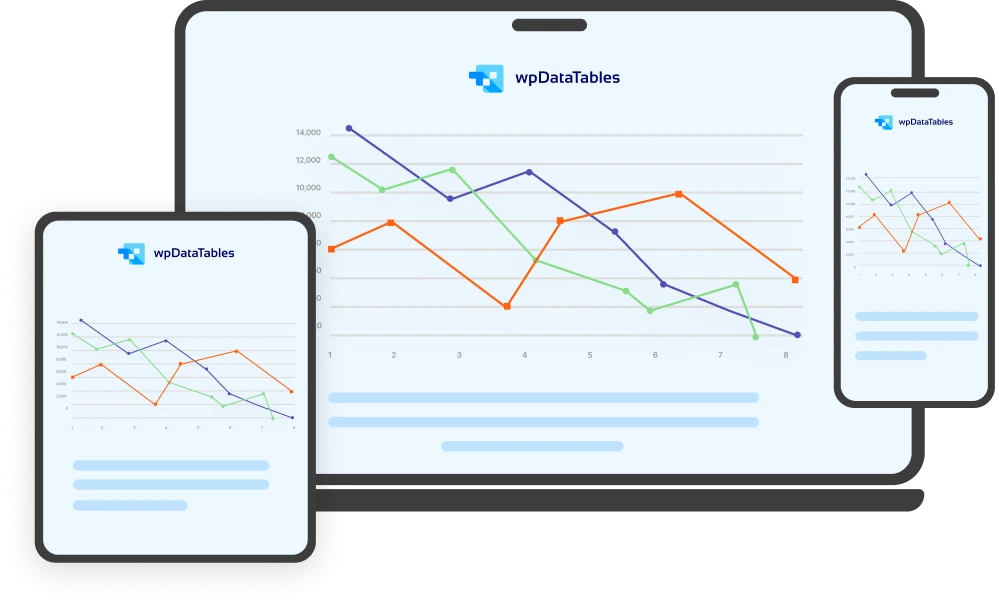
Charts that update themselves
Connect your charts directly to Google Sheets or your MySQL database, and your visualizations will update automatically whenever your data changes. No re-uploads. No manual editing. No outdated charts.
Don't just look, interact
Static charts are outdated. With wpDataTables, your tables and charts work together in real time. When users filter table data, select dates, change categories, or apply search queries, the connected chart updates instantly to reflect those changes.
It's not just a chart. It's a live, interactive dashboard running directly inside your WordPress site.