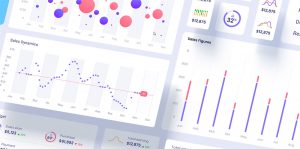
50+ Different Types of Graphs and Charts to Make Your Data Speak
Data is everywhere, but raw numbers alone rarely tell the full story. That’s where different types of charts and graphs come in—turning complex data into visual insights that are easier to understand, compare, and act upon. Whether you’re presenting sales trends, mapping geographical data, or analyzing customer behavior, knowing what types of graphs are there … Continue reading 50+ Different Types of Graphs and Charts to Make Your Data Speak
