Hi, everyone!
We’re proud to announce the next major update for wpDataTables plugin, which makes it even easier to create and edit tables. Starting from now you receive another editor interface, which is very similar to standard spreadsheet-editor (Excel, Google Spreadsheets, LibreOffice, OpenOffice). But this is not the only new feature! Full list follows.
Excel-like editor
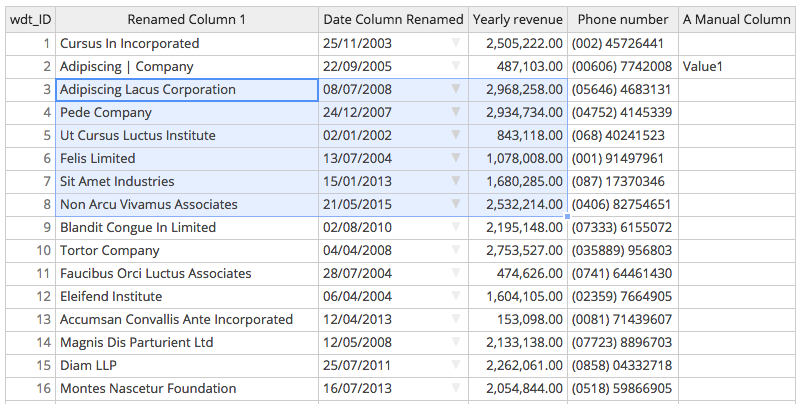
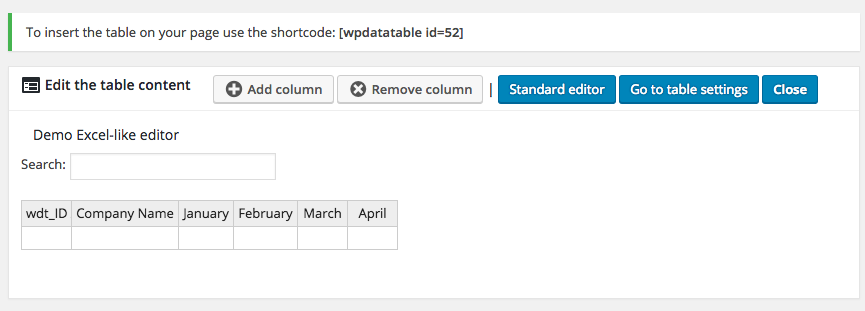
Starting from version 1.7 you receive one more interface that is very similar to Excel and other spreadsheet editors. It does not replace the standard wpDataTables editor interface fully, but rather provides an alternative, which can be used both in front-end and back-end. It introduces lots of new features that standard wpDataTables editor didn’t have, which will make your interaction with tables faster and more effective, especially when you’re working with numerical data:
- Browse through cells with arrow keys. You can use the standard arrow keys (and Enter) to browse between columns and rows and to modify exactly the cell that you need – or to quickly type in the data. Note please that the speed of interaction depends on your host.
- Selecting cells. Copy and paste columns and rows. Now, same as in Excel, you can use the mouse to select a range of cells (see screenshot above), copy it, and paste in a different place. You can copy content of one column to another, or of one row to another, etc.
- Drag and drop to fill cells. Duplicating selected content. Bulk-create rows. Same as in spreadsheet-editors now you can select a block of cells, click the mouse above a small square in the bottom right, and drag it down to duplicate the selected blocks content in the rows below. Even if the new rows do not exist. This can be used e.g. to duplicate a single row 30 times, if you need 30 similar rows – in previous versions of wpDataTables you would need to click ‘New’ 30 times to do this.
- Bulk delete rows. With the Excel-like editor you can select multiple rows, open the context menu by right-clicking the selected range, and choose “Delete rows” to delete all of them at once.
- Copy&Paste from external apps. You can copy&paste table content from external apps – just create the columns with same structure as in source, and then you can paste the data from Excel, Google Spreadsheets, LibreOffice, or simply from tab-separated table data.
Documentation on the Excel-like editor can be found here (click).
Please note the limitations of Excel-like interface, see the comparison table here (click).
See the video tutorial on this feature at this timeframe of the video overview: https://youtu.be/UoLLEom2A-g?t=1m31s
Lots of new formatting features for Charts
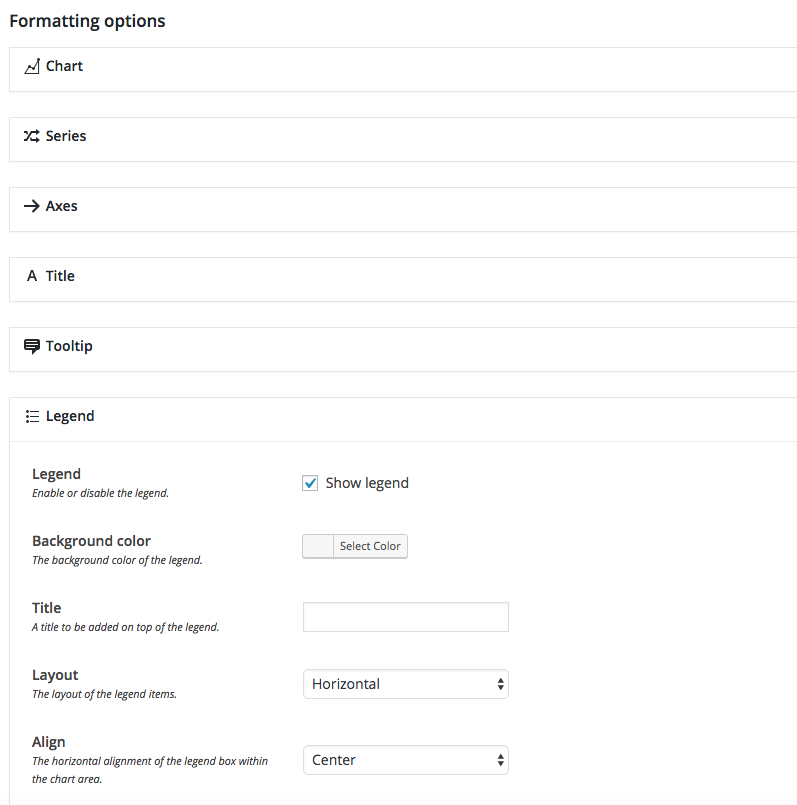
Both Google Charts and HighCharts received a lot of new formatting features. Among others:
- Background color. Now you can set the background of whole chart canvas to combine well with your site’s general styling.
- Canvas border. Now you can set the border for the whole chart canvas.
- Plot color. Now you can set the color for the plot (area behind the grid/chart itself).
- Plot background image (Highcharts only). Now you can set a background image for the plot.
- Zooming and panning (Highcharts only). Make your chart zoomable if it has lots of values. Also you can enable panning (scrolling through the zoomed chart).
- Grid line style. Now you can change the settings for the grid style.
- Min and max axes values. You can force-set the minimum and maximum values for the vertical axes.
- Title floating, subtitle. Define positioning and styling for the chart title, Highcharts additionally can have subtitle as well.
- Tooltip settings (Highcharts only). Define styling for the tooltip, value suffix and prefix (extremely useful for currency or percentage-related charts), “share” tooltip.
- Legend settings. Define styling and positioning of the chart legend.
- Exporting to image and print view (Highcharts only). Highcharts now allow exporting the image to PNG, JPEG, SVG, or to print view.
- Credits settings (Highcharts only). Toggle HighCharts credits on or off, or replace with your own text and link.
And lots of other options. See the overview in the video tutorial at this timecode: https://youtu.be/UoLLEom2A-g?t=15m8s
Grouping in Charts
Previously each new table row was treated as separate chart series. This didn’t work for all the tables, as some of the tables have multiple rows referring to the same chart entry. E.g. see this table:
| wdt_ID | Name | Apples | Bananas | Pears |
|---|
As you see, we have 2 rows for John, and 2 rows for Paul – but it’s logical that these rows shouldn’t be separate series for the chart. So now when you turn on the Grouping feature, rows with same labels would be treated as a single entry, summing up all the values in other cells.
See the overview for this feature in the video tutorial at this timecode: https://youtu.be/UoLLEom2A-g?t=26m49s
Import Google Spreadsheets to WordPress using Table Constructor
Previously there was only an option to create wpDataTables “linked” to Google Spreadsheets using the “Add from data source” feature.
However, these tables couldn’t be made editable, and weren’t fully integrated to WordPress database. Starting from version 1.7 you can also import the tables to MySQL database from Google Spreadsheets, and edit the data in WordPress afterwards.
See the documentation here.
See the overview for this feature in the video tutorial at this timecode: https://youtu.be/UoLLEom2A-g?t=29m39s
And even more new features…
See the related sections of the video overview at the provided timecoded links:
- New Settings page: https://youtu.be/UoLLEom2A-g?t=35m2s
- Generate Word DOCX and Excel XLSX files in WordPress using wpDataTables and Report Builder: https://youtu.be/UoLLEom2A-g?t=37m
- Advanced Table Duplicating: https://youtu.be/UoLLEom2A-g?t=31m18s
- Proper Multisite support.
Full Video Overview
If you do not want to check the new features separately, watch the full video overview of wpDataTables 1.7 new features:
Beta Testing
wpDataTables 1.7 is going to be in Beta testing phase for 2-4 weeks to make sure everything is completely stable before the official release. If you would like to become a Beta tester (possible only for existing wpDataTables users) please let us know in the support system. Thank you!
One question for you: do you prefer the video overview for next versions to be cut in multiple short videos, as these are perhaps easier to digest, or in one long video as this one? Let us know in comments here – or in YouTube!
Thanks!
