


Create WordPress Tables and Charts With a Single AI Command

“Create a bar chart of revenue by region from the Q1 Sales table.” One sentence. And a chart appears in your WordPress admin, ready to embed.


“Create a bar chart of revenue by region from the Q1 Sales table.” One sentence. And a chart appears in your WordPress admin, ready to embed.
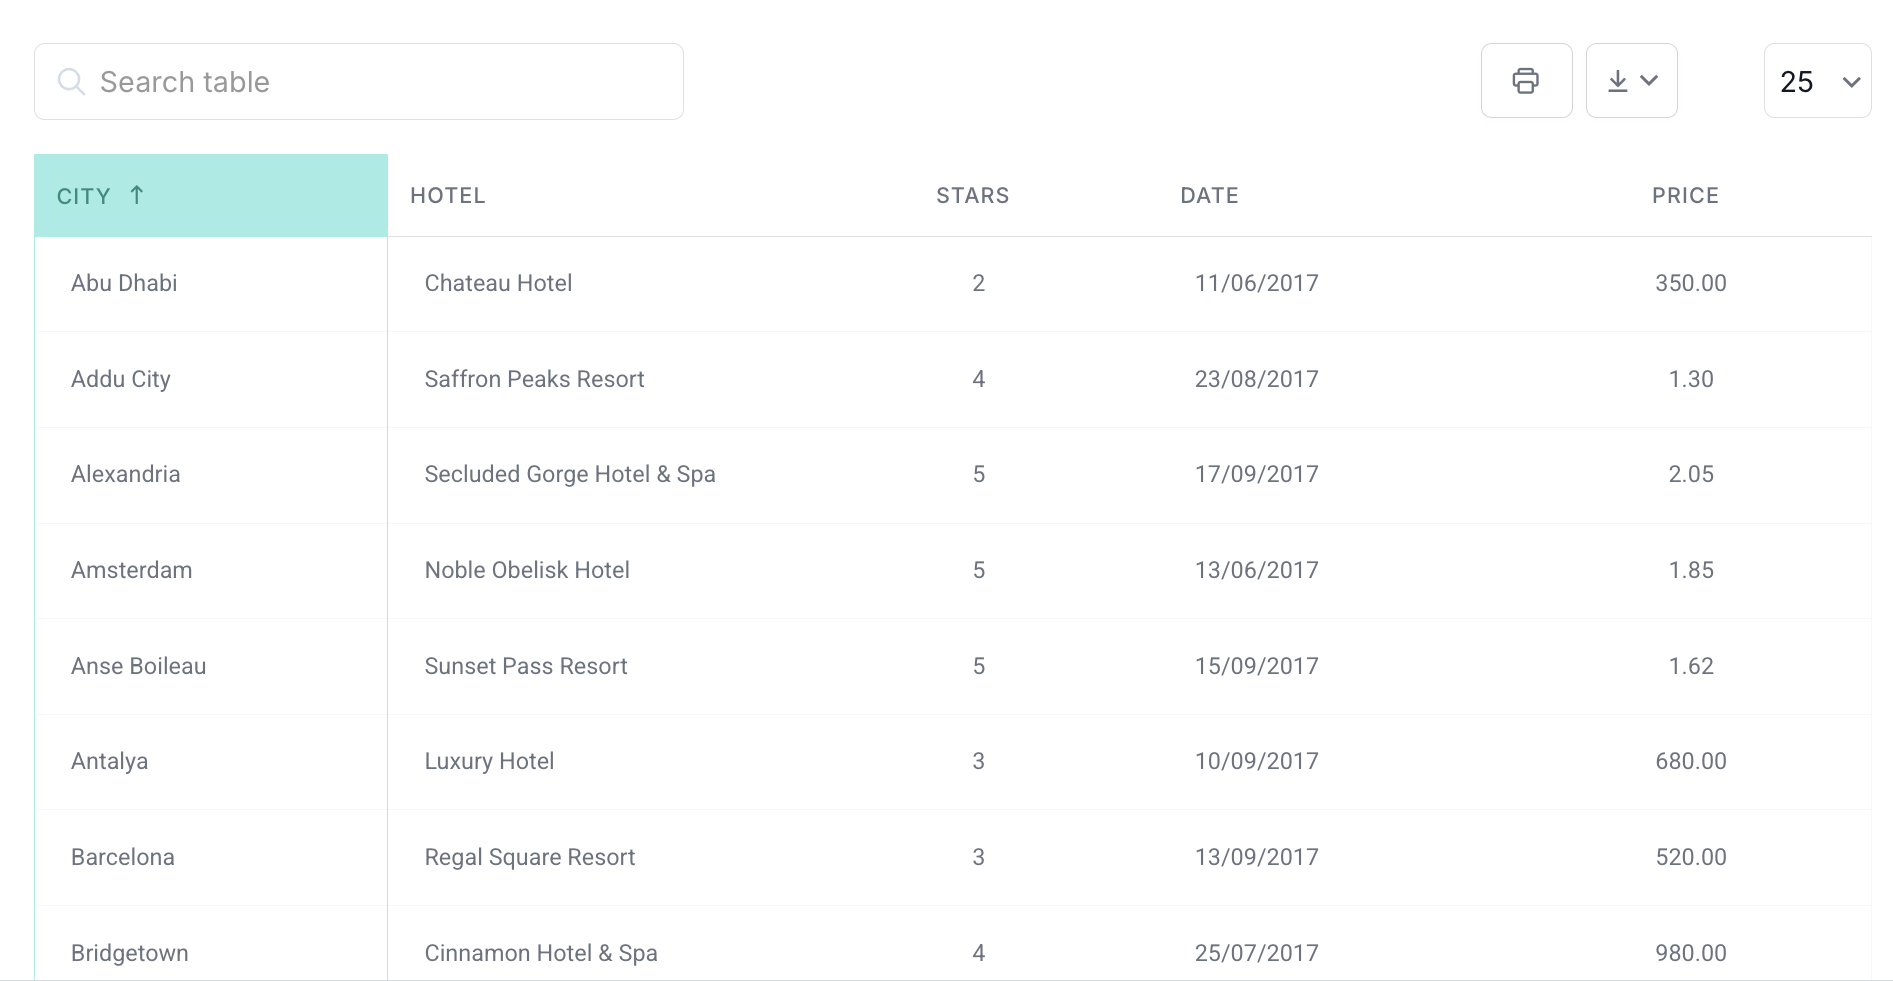
You’ve got data. Maybe it’s pricing tiers, feature comparisons, or a directory of services. You’ve even managed to get it into a table on your WordPress site. But something’s off. It looks clunky, the columns are uneven, and on mobile?…

Looking back on 2025, it feels like we’ve been on quite a journey together. For our team, this year was full of challenges, experiments, and small victories that reminded us why we love building wpDataTables.

Every December, something special happens across the WordPress ecosystem. The pace slows just enough for us to look beyond launches, dashboards, and deadlines, so we can focus on something bigger.

We’ve got something big in the works and it’s built just for you, the developers who love turning ideas into solutions.