How to Make a Table Responsive in a Few Easy Steps
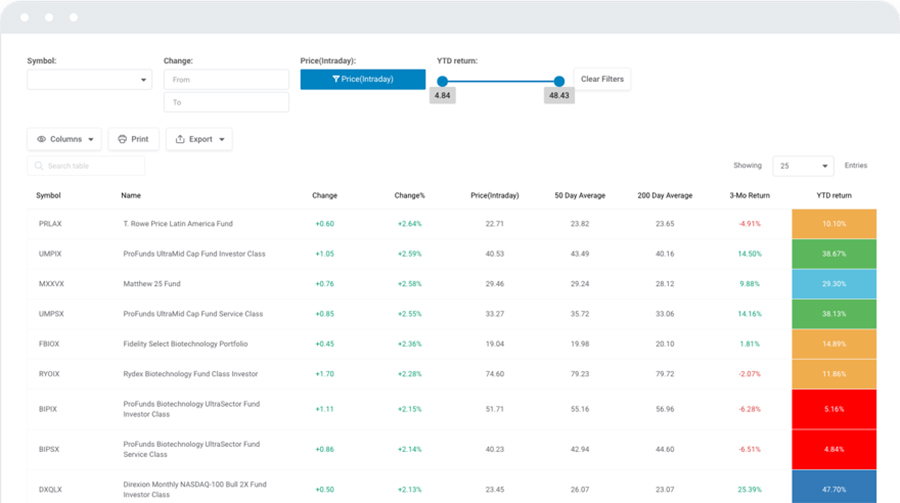
A table that looks perfect on your desktop might fall apart the second you open it on a phone. That is not a responsive table. Mobile is now over 64% of global web traffic (StatCounter, 2025). So when a data table spills…