Milan Jovanovic

Milan Jovanovic

Product Lead

Waterfall Charts: The Ultimate Guide

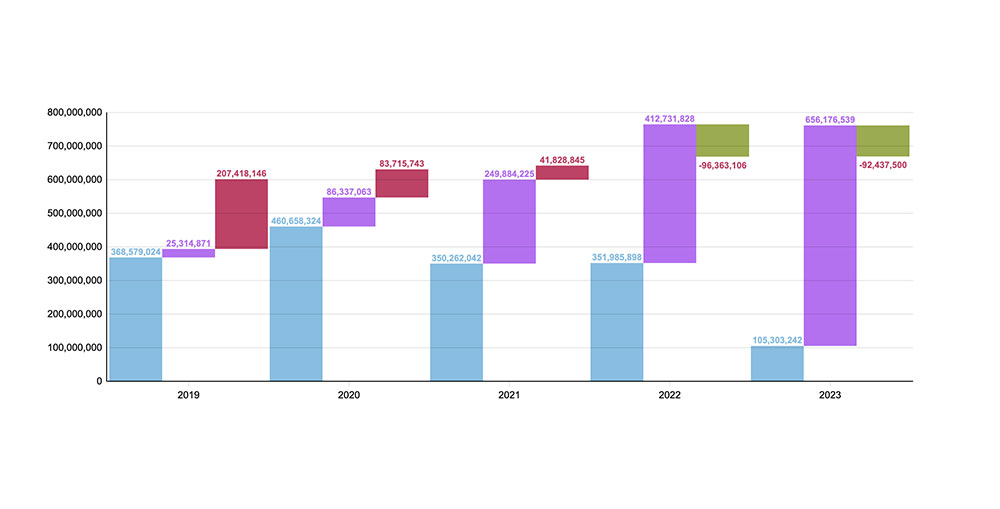
Waterfall charts are indispensable tools in financial analysis and data visualization. They can demystify complex data sets, clearly represent financial statements, and track increments like profit and loss over time. This article will dive deep into the mechanics of waterfall…

Candlestick Charts: The Ultimate Guide

Candlestick charts are essential for anyone serious about trading, providing crucial insights into market trends and price action. With origins in Japanese candlesticks, these charts have become a staple for technical analysis in financial markets. They reveal patterns and signals…

Pie Charts: The Ultimate Guide

Pie charts are an integral tool for data visualization, providing clear, at-a-glance insights into data distribution. Used extensively in business intelligence, marketing analysis, and presentations, these circular graphs represent data segments within a whole. By the end of this article, you’ll…

Line Charts: The Ultimate Guide

Line charts are indispensable tools for visualizing data trends over time. Whether you’re analyzing sales metrics, financial forecasting, or historical data, a line chart provides clarity and precision. In this article, we’ll explore the essentials of creating and utilizing line charts effectively. We’ll dive…

Bubble Charts: The Ultimate Guide

Bubble charts transform raw data into clear, interactive visualizations, bridging the gap between complex datasets and intuitive understanding. They plot data points with a third dimension—bubble size—representing an additional data dimension, making your data analytics more immersive. While traditional scatter…