Milan Jovanovic

Milan Jovanovic

Product Lead

Chart.js: All You Need To Know About The Charting Library

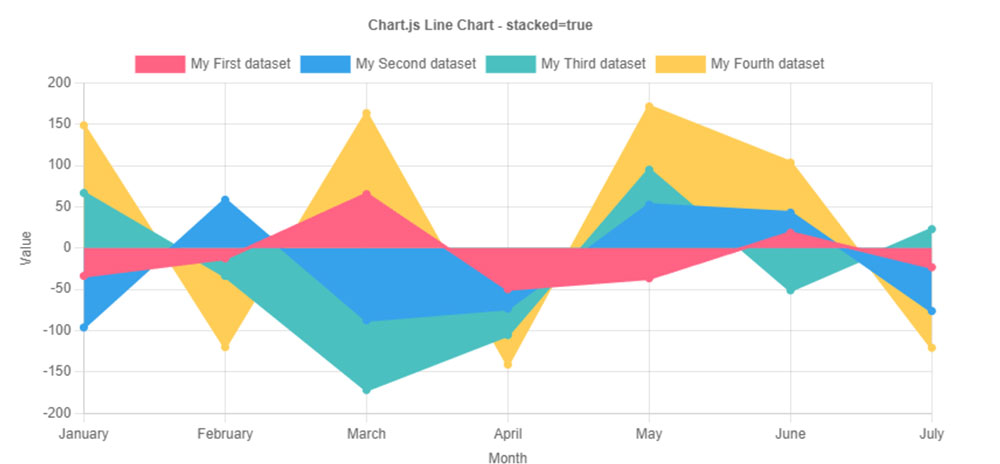
Data visualization is the pulse of modern digital communication, transforming raw numbers into compelling stories through dynamic charts and interactive graphs. As a professional, I’ve seen the magic unfold with Chart.js, a powerful JavaScript library that puts data representation right into your hands. Whether it’s bar charts, pie charts,…

What is Financial Data Visualization

Financial data visualization is crucial for understanding complex datasets quickly and intuitively. It’s not just about creating pretty charts; it’s about transforming raw financial metrics into actionable insights. Imagine utilizing powerful tools like Tableau, Power BI, or Excel to generate interactive dashboards and financial graphs that depict everything…