Interactive, visually-appealing charts can transform raw data into insightful stories. But if you’ve ever felt the constraints of basic charting libraries, it’s time to explore Chart.js plugins.
In the dynamic world of front-end development, Chart.js stands out as a powerful JavaScript library for crafting beautiful and responsive data charts. However, to truly harness its potential, plugins are essential.
These tools unlock advanced customization, real-time updates, and enriched data representation, pushing your visualizations beyond the ordinary.
Curious to learn more? By the end of this article, you’ll discover the best Chart.js plugins for enhancing your data visualization projects—covering everything from interactive charts and responsive designs to real-time data integration and performance optimization.
Dive in to find out how these transformative tools can elevate your web development skills.
Prepare to turn data into engaging, actionable insights that captivate and inform.
Table of Contents
Chart.js Plugins
autocolors
Automatic color generation for Chart.js based on dataset properties. Customize colors using modes like ‘dataset’, ‘data’, or ‘label’. Options include color offsets, repeating colors, and customizable functions. Requires Chart.js 3.0.0 or later.
colorschemes
Apply predefined color schemes to your Chart.js charts. Enhances visual appeal with easy-to-use schemes, supporting seamless integration. Offers a variety of themes to fit different chart types and data presentations.
gradient
Create gradient fills for your Chart.js charts. Define gradients with multiple color stops, enhancing chart aesthetics. Flexible configuration allows for linear and radial gradients, customizable per dataset.
rough
Adds a hand-drawn, sketchy appearance to Chart.js charts. Uses Rough.js for a casual, rough look. Perfect for informal presentations or creative projects needing a unique visual style.
style
Customize the appearance of Chart.js elements beyond default styles. Modify borders, shadows, hover effects, and more. Enhance the visual differentiation of datasets with rich styling options.
timestack
Visualize time-based data with stacked scales. Ideal for complex time series analysis, providing clear representation of overlapping time periods. Enhances readability and insight extraction from temporal datasets.
annotation
Add annotations to Chart.js charts for highlighting specific data points or ranges. Supports lines, boxes, and labels, improving data storytelling and context. Fully customizable for various annotation types.
Your beautiful data deserves to be online
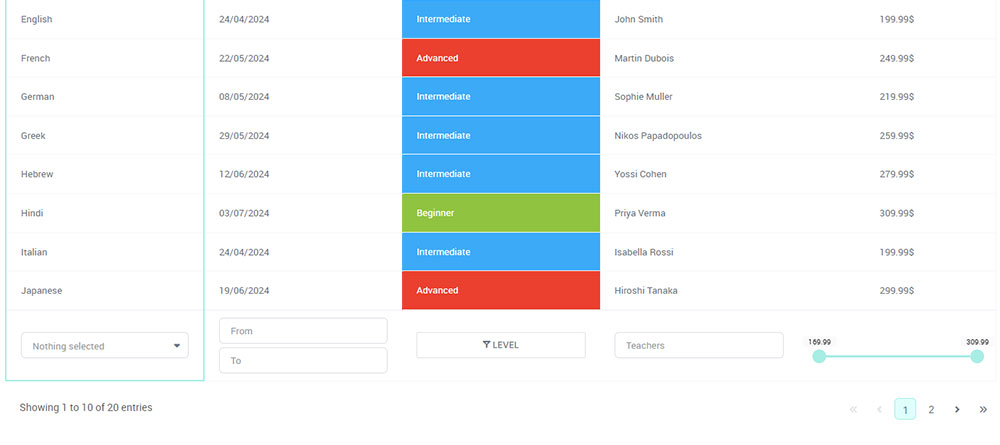
wpDataTables can make it that way. There’s a good reason why it’s the #1 WordPress plugin for creating responsive tables and charts.

And it’s really easy to do something like this:
- You provide the table data
- Configure and customize it
- Publish it in a post or page
And it’s not just pretty, but also practical. You can make large tables with up to millions of rows, or you can use advanced filters and search, or you can go wild and make it editable.
“Yeah, but I just like Excel too much and there’s nothing like that on websites”. Yeah, there is. You can use conditional formatting like in Excel or Google Sheets.
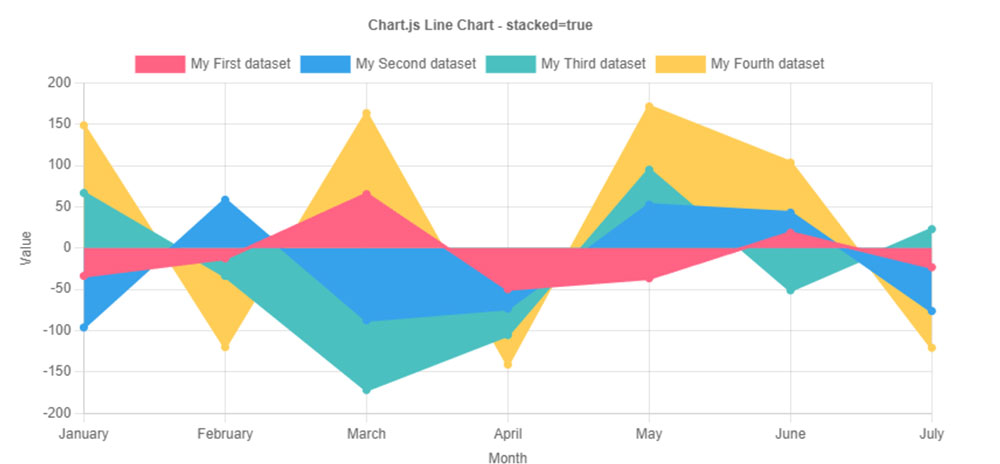
Did I tell you you can create charts too with your data – Chart.js included? And that’s only a small part. There are lots of other features for you.
Bonus: Check out 70+ Chart.js examples
crosshair
Enhance data interaction with crosshair and zoom functionalities. Provides precise data point tracking and improved user experience. Ideal for detailed data analysis and presentations.
datalabels
Display data labels on Chart.js charts with customizable positioning, styling, and formatting options. Enhances data readability and presentation clarity, supporting various label types and configurations.
doughnutlabel
Add labels to the center of doughnut charts. Provides a clear summary of the chart’s data, enhancing the overall information delivery. Supports multiple lines and rich formatting for comprehensive labeling.
hierarchical
Add hierarchical scales to Chart.js, allowing visualization of tree-like data structures. Ideal for displaying nested data with a clear hierarchy. Supports multiple chart types, enhancing data representation and readability.
image-label
Enhance doughnut charts by adding image labels. Integrates seamlessly with Chart.js, offering customizable image placement and sizing. Perfect for creating visually appealing and informative charts with graphical labels.
regression
Calculate and draw regression lines in Chart.js. Supports multiple regression types including linear, exponential, and polynomial. Enhance data analysis by visualizing trends and patterns directly on your charts.
waterfall
Create waterfall charts easily with Chart.js. Visualize cumulative data changes with clear breakdowns. Supports various customizations including step lines and stacked bars, perfect for financial and analytical presentations.
a11y-legend
Add keyboard navigation to Chart.js legends. Enhance accessibility with tab navigation, arrow key movement, and screen reader support. Ideal for making charts more inclusive and user-friendly.
chart2music
Convert Chart.js charts into music for the visually impaired. Uses Chart2Music to sonify data, enabling audio interaction. Integrates with screen readers, providing an auditory experience of chart data.
deferred
Defer initial chart updates until the canvas is in the viewport. Enhance performance by delaying chart animations until visible. Ideal for optimizing load times and user experience on content-heavy pages.
dragdata
Make Chart.js data points draggable. Supports touch events, allowing interactive data manipulation. Customize drag behaviors, making charts more dynamic and user-interactive for various applications.
zoom
Add zoom and pan functionality to Chart.js. Supports mouse and touch gestures for dynamic interaction. Ideal for detailed data analysis, enhancing user engagement with interactive zooming and panning.
datasource-prometheus
Integrate Prometheus data into Chart.js. Load time-series data from Prometheus, similar to Grafana but for public-facing applications. Supports multiple queries, stacked series, and customizable chart messages.
streaming
Add live streaming data capabilities to Chart.js charts. Supports real-time data feeds, ideal for monitoring applications. Compatible with Chart.js 3.0.0 and later, ensuring seamless integration for dynamic data visualization.
FAQ On Chart.js Plugins
What are the best Chart.js plugins for data visualization?
For data visualization, Chart.js plugins enhance features like interactivity, real-time updates, and customization. Popular options include chartjs-plugin-annotation, chartjs-plugin-datalabels, and chartjs-plugin-streaming.
These plugins make your charts more informative and visually appealing, offering advanced capabilities that go beyond the core Chart.js library.
How do I install Chart.js plugins?
To install Chart.js plugins, you can use NPM by running npm install <plugin-name>, or include the plugin via CDN links in your HTML. Make sure it’s compatible with your Chart.js version. Integrate the plugin by adding it to your Chart.js configuration.
Can I use multiple plugins simultaneously in Chart.js?
Yes, you can use multiple Chart.js plugins together. Simply include and configure them as needed in your project.
Ensure each plugin’s settings don’t conflict with others to maintain smooth functionality and enhanced capabilities in your data visualization with Chart.js.
How do Chart.js plugins improve performance?
Chart.js plugins like chartjs-plugin-streaming enhance performance by optimizing real-time data charting and reducing rendering load.
By streamlining data updates and employing efficient rendering techniques, these plugins maintain the responsiveness and speed of your JavaScript chart plugins even with large datasets.
Are there plugins for customizing Chart.js animations?
Absolutely, plugins like chartjs-plugin-animation offer advanced options for customizing Chart.js animations.
You’ll have control over animation timing, easing functions, and more, making your charts not only informative but also visually captivating. Such flexibility is vital for engaging interactive charts.
What plugins are available for enhancing interactivity in Chart.js?
Enhance interactivity with plugins like chartjs-plugin-zoom, which enables zooming and panning, and chartjs-plugin-annotation, allowing annotations on charts.
These tools transform static charts into interactive data representations, enriching the user experience and providing deeper insights.
How do I configure Chart.js plugins?
Configuring Chart.js plugins involves adding specific options to your Chart.js configuration. Each plugin comes with its documentation, outlining settings and customization methods.
Familiarize yourself with these to fine-tune the functionalities and achieve the desired chart enhancements.
What are the latest updates in Chart.js plugins?
The latest updates in Chart.js plugins often introduce new features, performance improvements, and bug fixes.
Keep an eye on plugin repositories on GitHub for the latest releases and changelogs. Staying updated ensures you leverage the best capabilities in your web development projects.
Can Chart.js plugins be used with different versions of Chart.js?
Compatibility varies. Check each plugin’s documentation or repository on GitHub for version compatibility details.
Some plugins might support specific versions only, so aligning your Chart.js library with the right plugin version is crucial for seamless integration and functionality.
Where can I find documentation for Chart.js plugins?
Find documentation for Chart.js plugins on repositories like GitHub, the plugin’s website, or within the Chart.js community forums.
Comprehensive guides, examples, and usage tips can assist you in effectively integrating and customizing plugins for optimal data visualization results.
Conclusion
Exploring the realm of Chart.js plugins opens a door to a world where data visualization transcends basic charts, evolving into a comprehensive storytelling experience. These plugins serve as catalysts, enhancing your JavaScript chart plugins with advanced features like real-time data updates, interactive elements, and responsive designs.
Easily integrating these tools into your projects not only boosts the functionality of Chart.js but also magnifies the user engagement and impact of your graphical data. Whether you’re interested in custom animations, data labels, or zoom capabilities, there’s a plugin tailored to elevate your front-end development endeavors.
By leveraging the right plugins, you can optimize performance, achieve seamless Chart.js integration, and deliver charts that are not just visually appealing but also deeply informative. Your journey into data visualization will benefit immensely from the plethora of plugins available, propelling your work to new heights of innovation and insight.