Ever found yourself drowning in rows of numbers, struggling to extract meaning from the mess? You’re not alone. In the world of data, the tools we use to present information can make or break our message.
Enter charts and tables—the twin titans of data visualization. One offers structure, precision, and depth. The other dazzles with patterns, trends, and immediate impact. Both are powerful, but each has its moment to shine.
Charts are better for spotting trends and delivering quick visual insights, while tables excel at presenting detailed, exact figures.
This guide helps you choose the right one based on your audience, format, and purpose—so your data doesn’t just sit there, it speaks.
Let’s get started.
Table of Contents
Charts vs. Tables: Quick Comparison
| Aspect | Charts | Tables |
|---|---|---|
| Visual Form | Graphical; represent data visually as bar graph, line chart, etc. | Text and numbers organized in rows and columns. |
| Data Volume | Effective for summarizing large amounts of data. | Can display large volumes of data in a compact form. |
| Complexity | Can illustrate complex relationships through visuals. | Can become complex if there is too much data or too many details. |
| Analysis | Good for identifying patterns, trends, and relationships. | Good for precise, detailed analysis and comparisons. |
| Accessibility | Quick to interpret for an overview & general trends. | Requires more time and attention to understand details. |
| User-friendly | More engaging and easier for a general audience. | Better suited for users familiar with the subject or dataset. |
| Detail | May lack specific details or exact values. | Provides specific numerical values and detailed information. |
| Specificity | May require further explanation or a table for exact figures. | Exact figures are given and clearly defined. |
| Comparison | Visual cues make comparisons straightforward. | Side-by-side comparison requires more cognitive effort. |
| Usage Context | Ideal for presentations and reports where visual impact is key. | Ideal for academic, scientific, or detailed financial analysis. |
| Customization | Colors, styles, and elements can enhance comprehension. | Formatting such as shading and borders can aid organization. |
| Interpretation | Can be subject to misinterpretation due to scaling or design. | Less prone to misinterpretation as values are explicit. |
| Space | Can take more space compared to tables or be unclear if shrunk. | Can be very space-efficient but may become crowded. |
| Data Type | More suitable for quantitative data and sometimes qualitative. | Suitable for both quantitative and qualitative data. |
| Time Series | Excellent for showing changes over time. | Can show time series, but typically less intuitive than charts. |
What Is a Chart?
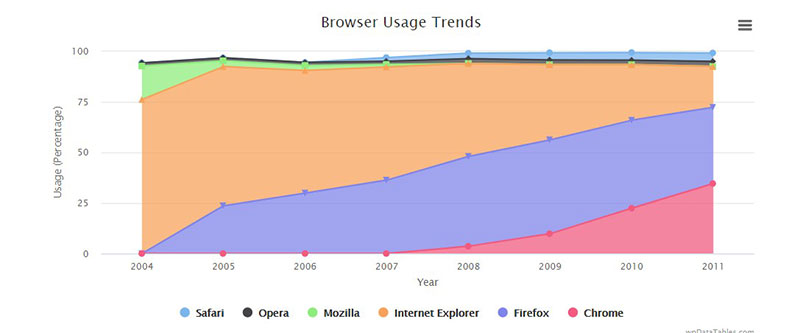
Charts and graphs display data in a visual format, showing relationships between different data sets. It is easy to see patterns and, in some cases, future trends can be identified.
Charts take on many forms, and one of their key functions is they can display a great deal of data in a simple and comprehensible way.

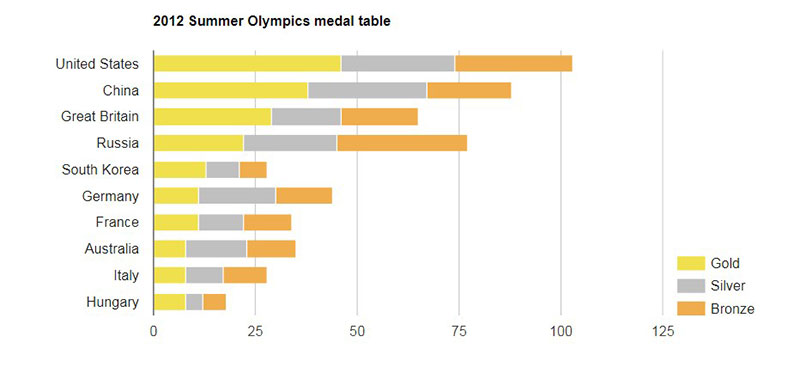
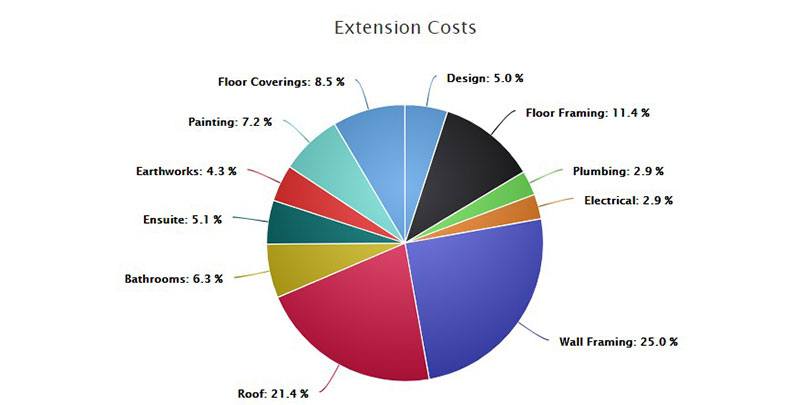
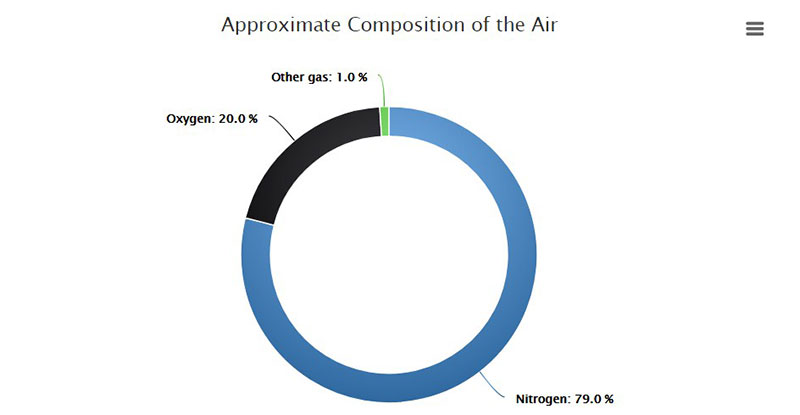
A chart is used when you need to communicate complex information to show patterns and trends. Pie charts can quickly explain relative proportions of time or resource usage. Bar charts show distributions of results. An X-Y chart can be used to calculate an equation for the relationship between two data sets.
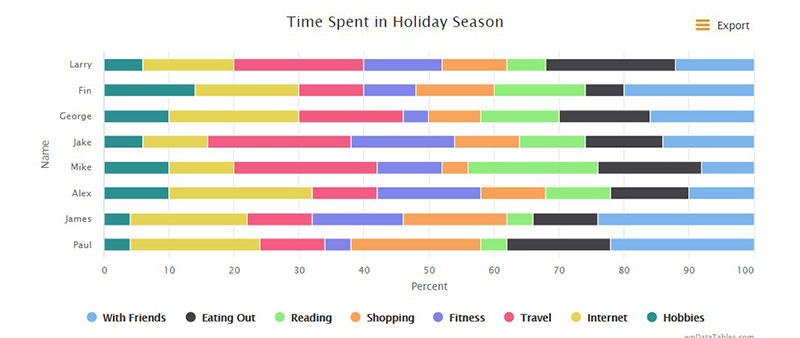
A chart allows the viewer to quickly understand the data and provides the ability to dig deeper into the data to fully comprehend it. Charts help to easily answer questions such as: Is the problem increasing over time? Who is spending the most on this type of holiday? How is the strength of my steel bar affected by the alloying elements?.
When to Use Charts?
If you have complicated data that needs to be simplified and presented in a way that shows a pattern or trend, a chart should always be used. They can be used to show the following:
- Trends over time. How many new cases of Covid-19 are there each day?
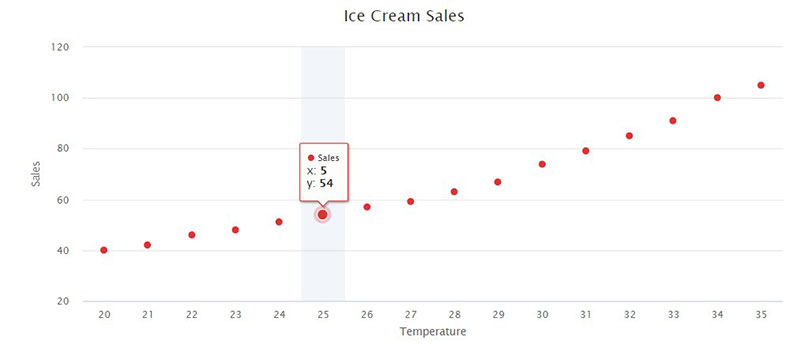
- Patterns or shapes of data. Is there a straight-line growth in demand for ice cream or are there seasonal variations superimposed on that growth?
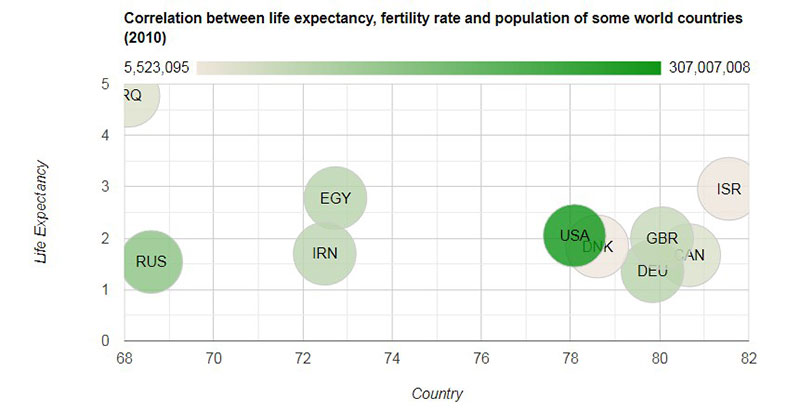
- Explaining the relationship between two or more sets of data. Does the BMI (Body Mass Index) of a person impact their blood pressure?
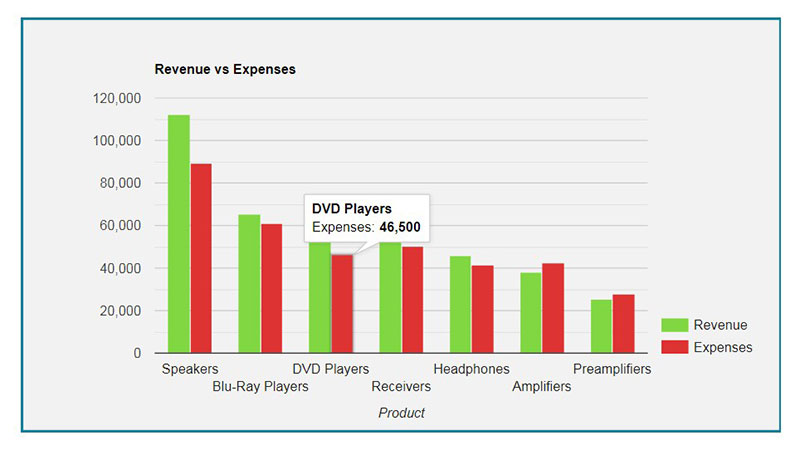
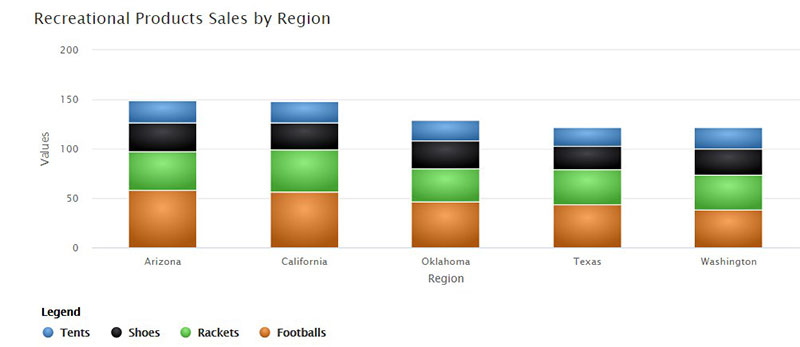
- Illustrating the size of values compared to each other. A bubble chart, for example, could show the price and overall volume of sales for a group of product lines.
- Displaying variability, either using a distribution curve using a bar chart or a best-fit line on an X-Y chart to illustrate the variation from the ‘norm’.
- Highlighting ‘odd-ball’ results and helping to explain them.
- Collecting high volumes of data. Global population trends can be summarized by averages in continents or individual countries.
- Visualizing aspects of your data. Are there geographical patterns that appear? Which US State has the highest average IQ?
If in doubt, always use a chart rather than a table. Our minds tend to receive information more quickly with a chart.
Charts can be overused. Pick out the key information and use the most appropriate chart. There is a tendency to fill our presentations with too many pie charts, which can distract from the vital information in your presentation.
Free Chart Type Picker
What Is a Table?
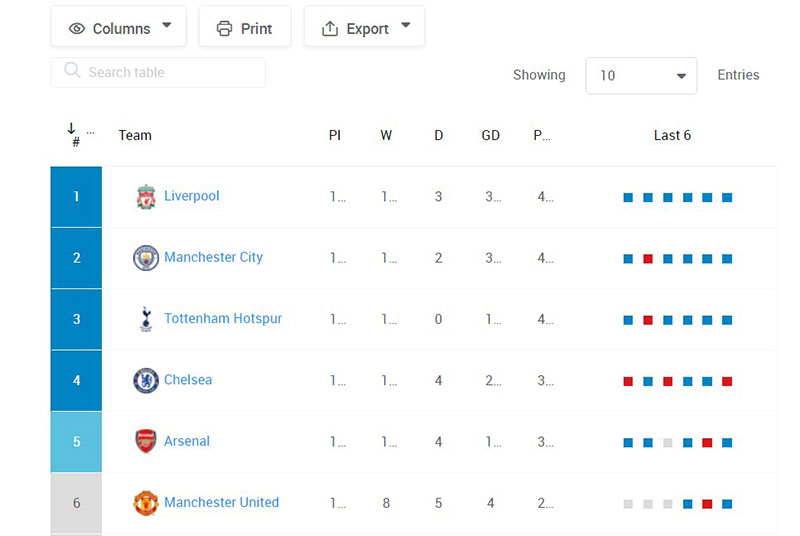
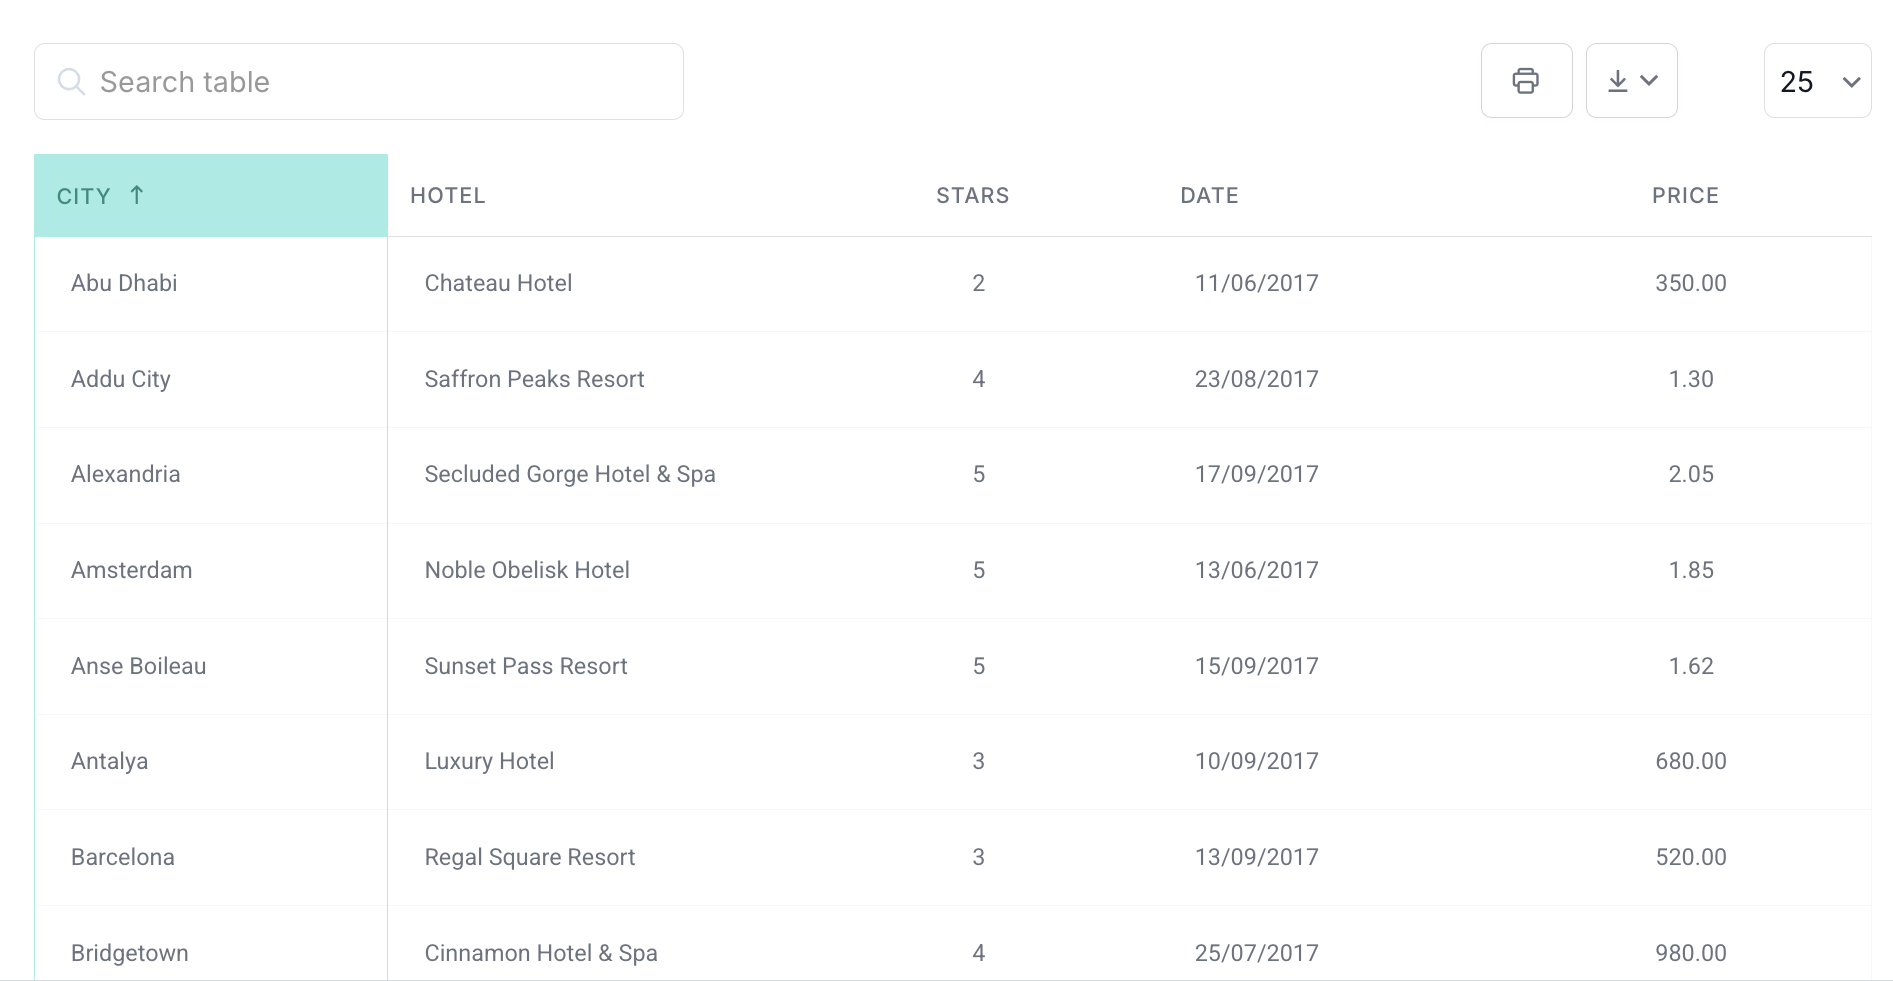
A table is data arranged in columns and rows. It can also include grid lines to separate the data. Each intersection of a column and a row represents one piece of data. This is called a ‘cell’.
Tables can also display text, color, symbols, or any other relevant information. Tables can be anything from a few columns and rows to multidimensional data sets like multiplication tables.
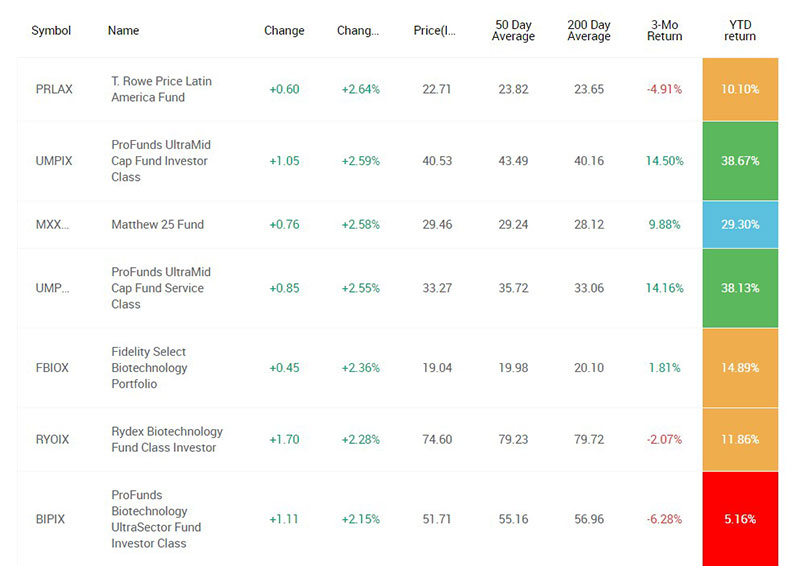
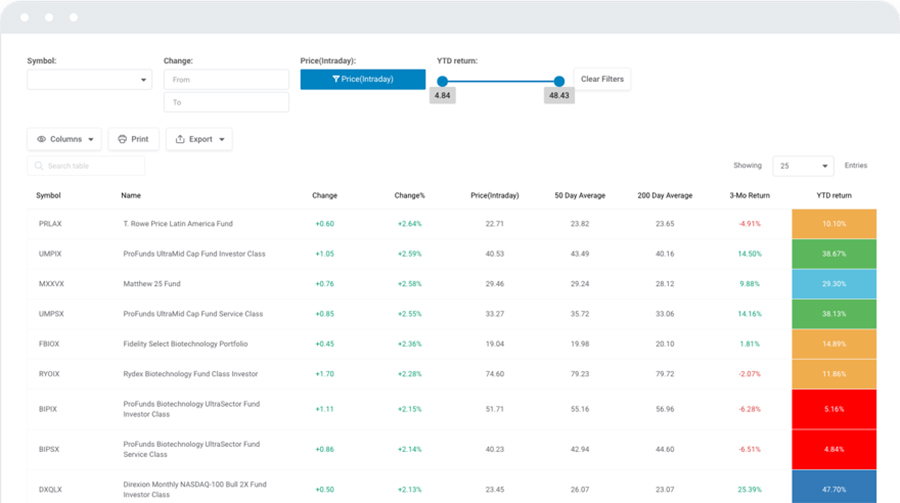
Tables should be used instead of charts when precision is key, for example, product tables, a scientific or medical research report. These readers need to be able to probe deeper into the results rather than getting a general picture from a chart or graph.
Tables are also useful for looking at multidimensional information that is impossible to show on a chart.
When to Use Tables?
A table is the best option if you have data that needs to be analyzed in detail, being less abstract and allowing close examination of specific results. It is important to remember to use tables when using data from scientific research or medical trials.
Sometimes data just cannot be displayed on a chart. If you have fourteen variables associated with the final strength of a sample of steel, it is difficult to show that visually.
Use a table in the following situations:
- If the reader needs to look at specific values within the data set.
- If the precise value is key rather than a trend or general pattern.
- If there are multiple outputs or inputs to be analyzed.
- If there is specific information and averaged results included in the data.
So, Charts vs. Tables? When to Use One or the Other?
Deciding when to use charts vs. tables depends on the audience and how you want the data to be used. Charts are better for trends and visual insights; tables are best for detailed, precise data.
People react very differently to the way the information is presented, and it is essential that you focus on the effectiveness of your message. There is no point in simply entertaining the viewer with a glamorous chart when the specific data is not clearly understood.
Audience
It all begins with your audience. If they tend to be analytical and want to examine the raw data, a table is the best choice. If they prefer a quick summary of the information a chart would be sufficient.
Raw vs. processed data
Tables show raw data. Charts summarize and smooth data for visual effect. If you want precise values, use tables. If you want generalizations, use charts.
Publishing format
How you present data to the viewer makes all the difference. If you are sending out a printed report to your peers, then a table can be reviewed at their leisure. If your data is presented on television or on social media, then use charts.
Presentation context
In addition to formatting the data, the way that the audience will interact with it needs to be considered. Questions such as; will the audience have time to sit back and read the information? Will you have the opportunity to clarify points, or does the document have to stand up to scrutiny on its own?
Insights
Charts are great for summarized data. They show shapes and patterns that supply insights quickly and efficiently. Tables give the raw data and leave it up to the reader to work out what it shows. A combination of the two can be useful. Display the data in either one or two charts. Then show the raw data in a table, either in the body of the report or in the appendix.
Charts vs. Tables: The Verdict
When it comes to presenting data effectively, there’s no one-size-fits-all solution. Both charts and tables serve distinct, valuable purposes—and the best choice often depends on your goals, audience, and context.
Why not both?
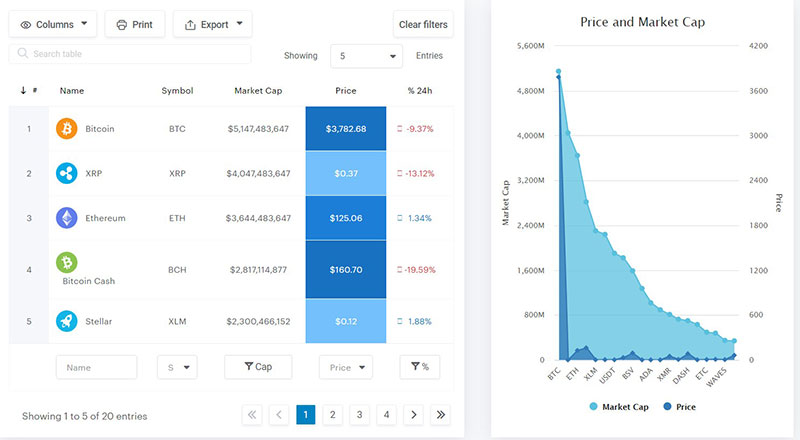
Rather than choosing one over the other, consider how each format can complement the other. Here’s how they differ and how they can work together:
-
Different Lenses on the Same Data: A table lays out raw numbers in detail—perfect for precision, analysis, and reference. A chart, on the other hand, transforms that same data into a visual story, helping audiences grasp trends and relationships at a glance.
-
Charts Show the Big Picture: Well-designed charts can emphasize comparisons, highlight outliers, and communicate movement or change over time. Adding data labels to your charts enhances clarity by reinforcing the actual values behind the visuals.
-
Tables Deliver the Detail: If someone needs to dig deeper, tables provide the granularity that charts often skip. This is especially useful for technical audiences or decision-makers who want to verify or cross-reference numbers.
-
Summaries and Supporting Data: A chart might summarize key metrics from a detailed table. Conversely, a table might support a chart by offering additional context—like breaking down a total into regional contributions or time-based segments.
-
Know Your Audience: Visual learners and executives often benefit more from charts, while analysts or stakeholders looking for accuracy might prefer tables. Tailor your presentation based on who’s reading and what they need to do with the data.
The most impactful presentations often don’t choose between charts and tables—they use both strategically. When thoughtfully combined, they offer both clarity and depth, allowing your data to inform, persuade, and inspire action.
Best Practices for Creating Effective Charts and Tables
Presenting data clearly is just as important as the data itself. Whether you’re designing charts for a blog post, report, or dashboard, following these best practices will help ensure your visualizations are both insightful and easy to understand.
1. Avoid chartjunk
Keep your visuals clean and minimal. Extraneous elements like heavy gradients, 3D effects, or unnecessary icons distract from your message. Prioritize clarity and only include visual elements that add value.
2. Use clear labels and legends
Every chart and table should be self-explanatory. Use concise, descriptive titles. Label axes clearly and directly. If a legend is necessary, make sure it’s easy to interpret and placed near the data it describes.
3. Choose the right type of chart
Match the chart type to your message:
-
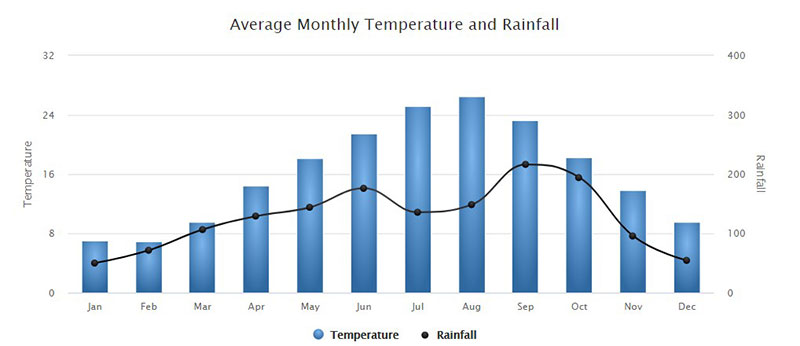
Bar charts work well for comparing quantities.
-
Line charts are great for showing trends over time.
-
Pie charts are best for showing parts of a whole—but only when the number of slices is limited.
When in doubt, go with the simplest chart type that communicates the insight effectively.
4. Limit the number of categories
Clutter kills comprehension. Try to limit pie or bar charts to 5–7 categories. If you have more, consider grouping smaller segments into an “Other” category or using a different visualization type entirely.
5. Ensure tables are mobile-friendly
If you’re displaying tables on the web, make sure they’re responsive. Use stacked rows or scrollable containers for small screens, and avoid cramming too much content into each cell. Prioritize legibility over density.
Conclusion: Choose with Purpose
In the world of data presentation, both charts and tables have powerful roles to play:
-
Use charts to emphasize patterns, trends, and comparisons at a glance.
-
Turn to tables when accuracy, detail, and exact values matter.
-
Think about your audience, goals, and delivery format—these will shape the most effective choice.
-
Don’t hesitate to use both together when clarity and depth are needed.
The key isn’t choosing one over the other—it’s choosing intentionally.
Next time you’re building a dashboard or report, pause and ask:
Does your data need to inform, convince, or reveal patterns?
Your answer should guide your choice.
Need a flexible way to create interactive, responsive tables and charts in WordPress—without code?
wpDataTables makes it easy to do both in one place.
FAQs About Charts vs. Tables
When should I use a chart instead of a table?
Charts are your go-to when the story behind the numbers matters. If your data has movement—trends, patterns, comparisons—a chart delivers that message at a glance. It’s about visual clarity and instant impact.
When is a table more effective than a chart?
Tables shine when precision matters. If your audience needs to see exact numbers, compare specific values, or dive into granular details, a table puts the data front and center—clean, organized, and unambiguous.
What types of charts are best for showing trends over time?
Line charts are made for timelines. They connect the dots—literally—making it easy to track change, momentum, and direction across time. Think of them as the pulse of your data.For trends, timelines are gold mines.
Are tables better for comparing quantitative data?
Yes—especially when multiple values need to be reviewed side by side. Tables make comparisons straightforward, turning rows and columns into decision-ready layouts.
How can I decide between pie charts and bar graphs?
Pie charts show the proportions of a whole—great for illustrating how one slice compares to the rest. Bar graphs, on the other hand, are better for comparing quantities across categories. If it’s a competition or ranking, bar wins.
Can charts misrepresent data more easily than tables?
They can. Misused scales, manipulated axes, or overloaded visuals can distort reality. Tables, while less flashy, are harder to twist—what you see is what you get.
When should I use a line graph instead of a bar chart?
When you’re tracking progress or change over time. Line graphs create a continuous narrative, perfect for showing how things rise, fall, or evolve—ideal for trend analysis and forecasting.
Is tabular data easier to analyze than charted data?
It depends on the task. For raw analysis and exact value inspection, tables are ideal. For quick insights and broader patterns, charts win. In many cases, using both is the smartest move.