Welcome back! We hope that you’ve had a good rest and that you are ready for new goals! The interesting stuff is prepared for you so we can have a great start to the year. Let’s not waste any more time, let’s see what’s new.
Numeric range filter – Unlimited option
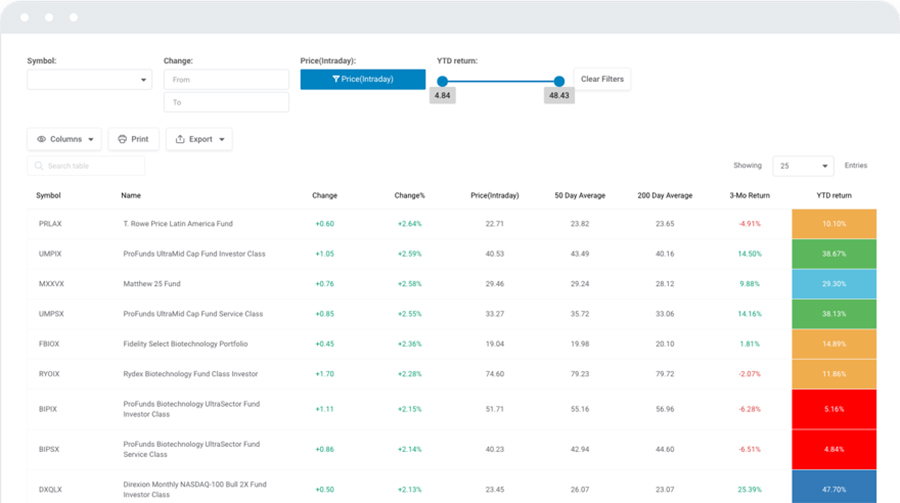
In the top three feature suggestions, you asked for Numeric Range with unlimited value. For those of you who don’t know an unlimited option in a numeric range slider typically allows the user to select a range that extends infinitely in one direction. For example, if the slider represents storage from 0 to 100GB, the unlimited option would allow the user to select all storage greater than or equal to a certain value, without an upper limit. If you want to know more, please check out our documentation about Numeric Range with unlimited value.
In the example below, you can see all options you can use for “Unlimited value”:
- Max number value that exists in selected column
- “Unilimited” as a text value
- “∞” simbol for unlimited value
- Custom text that you want to show

Below, you can see an example of an Unlimited filter. Try it out.
| Cards | Storage |
|---|---|
| SD | 2 |
| SDHC 16 | 16 |
| SDXC 32 | 32 |
| SDUC 2 | 2,000 |
| SDHC 8 | 8 |
| SDHC 4 | 4 |
| SDXC 64 | 64 |
| SDXC 1 | 1,000 |
Table description
With this feature, you would be able to include information about the table’s columns, data types, constraints, indexes, and relationships to other tables. But this is all your choice. You can enter whatever you want. You can also choose whether you want to show this description to your clients on the front-end or just leave it visible in the back-end. This option is available for all types of tables. If you want to know more, please check our documentation about Creating a table and Table description option.


Column header and cell alignment
Two new table customization options are here. From now on, you can make adjustments to the header and column alignment to suit your needs. You can choose if you want all your data to be centered to the left, right, or center. If you want to know more, please check out our documentation about Collumn settings.
| LEFT | CENTER | RIGHT |
|---|---|---|
| LEFT | CENTER | RIGHT |
| LEFT | CENTER | RIGHT |
| LEFT | CENTER | RIGHT |
| LEFT | CENTER | RIGHT |
| LEFT | CENTER | RIGHT |
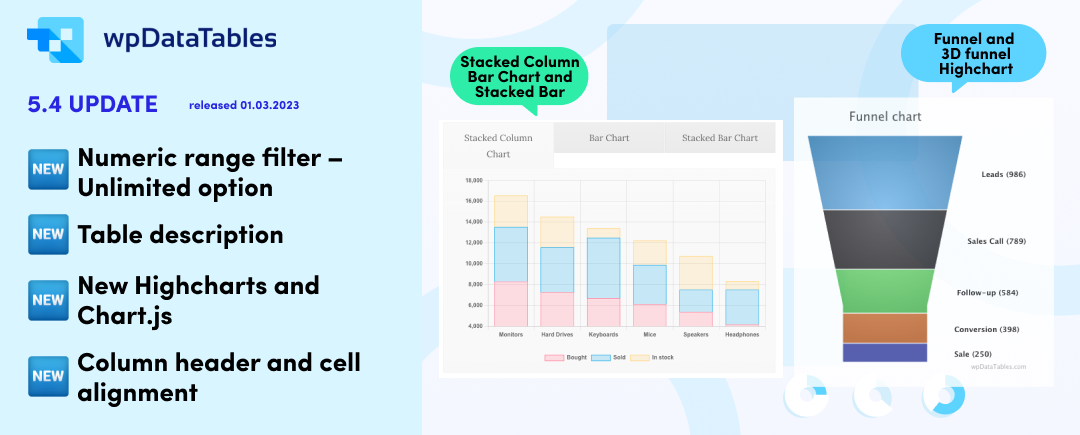
Highcharts
We’ve added two new Highcharts, Funnel and a 3D Funnel Chart. Funnel charts are graphical representations of how data moves through a process. Basically, these two charts can show a process that starts at 100% and decreases throw the stages. If you want to find out more about these charts, check out our documentation and see other Highcharts examples.
In the example below, you can see what the recruitment process looks like.
Chart.js
In this charting library, we’ve added four new charts. Depending on your needs, from now on, you can use Stacked Column Chart, Bar Chart and Stacked Bar Chart. If you want to find out more about these charts, check out our documentation and see other Chart.js examples.
That’s all for now, but new features are coming very soon. We prepared really great stuff and we are sure that you’ll like it. If you have any suggestions, feel free to contact us on feature suggestions. Thank you for cooperating with us. All the best from wpDataTables team.