Milan Jovanovic

Milan Jovanovic

Product Lead

Box Plots: The Ultimate Guide

Imagine unraveling the hidden stories within numbers. Box plots, those sleek graphical powerhouses, whisper secrets of data trends and outliers that might otherwise slip unnoticed. They’re not just visuals; they’re narratives of information, waiting to be told. Plumbing the depths…

Scatter Plots: The Ultimate Guide

Imagine unearthing patterns hidden within seas of data with a simple, yet powerful tool – scatter plots. Picture this: each dot representing a story, a clue that, when combined, reveals trends, connections, and insights that could revolutionize your understanding of…

Funnel Charts: The Ultimate Guide

Imagine this: your website’s the stage, and every visitor’s part of the audience, each at different rows of seats. Now picture funnel charts as the spotlight, guiding you smoothly from the back rows to the thrilling front row—the conversion zone.…

Scatter Charts: The Ultimate Guide

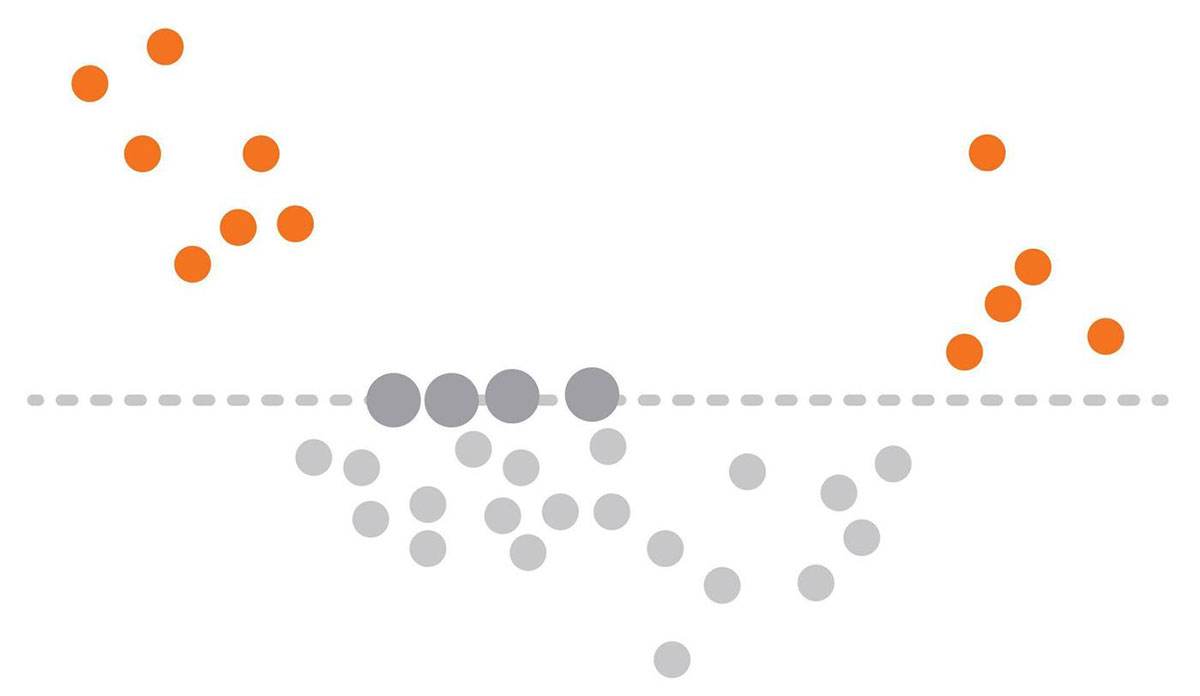
Scatter charts are indispensable tools in data visualization and statistical analysis, offering a clear view of the relationship between variables. Whether you’re analyzing data patterns, identifying outliers, or examining correlations, scatter charts provide a straightforward, visual representation that aids in understanding complex datasets. Data…