Expert Tips for Styling HTML Tables for Better UX
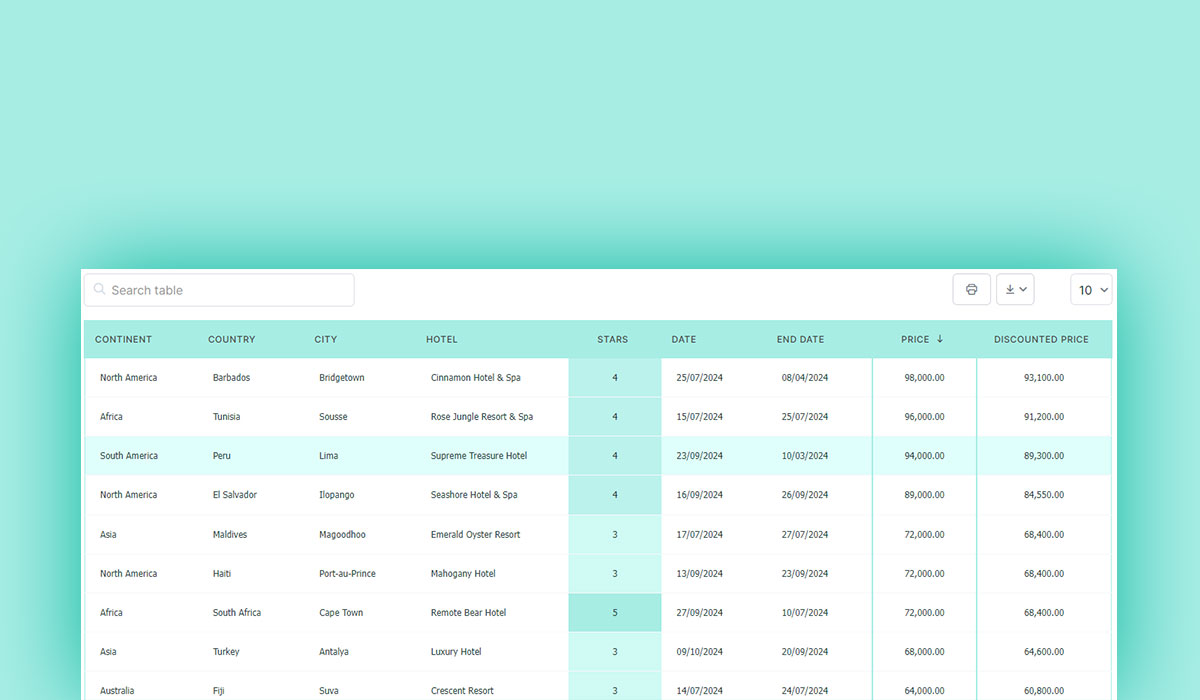
Styling HTML tables can transform a mundane grid of data into an aesthetically pleasing and highly functional part of your web design. You’ve probably encountered countless unstyled tables that look straight out of the 90s. That’s where CSS comes into…