Clients want visibility without having to ask for updates all the time. They want one place where they can check project progress, campaign results, budgets, or key deliverables on their own.
That is exactly what a client dashboard does. Instead of sending manual reports or replying to the same status questions every week, you give clients a clear view of the information they care about most.
WordPress is a practical place to build that kind of dashboard, especially when you use tables to keep the data structured and easy to scan. You don’t need a complex system to make it useful.
In this article, we will show you how to build a client dashboard in WordPress using tables, what information to include, and how to keep the dashboard clear and easy for clients to use.
Table of Contents
What Is a Client Dashboard in WordPress?
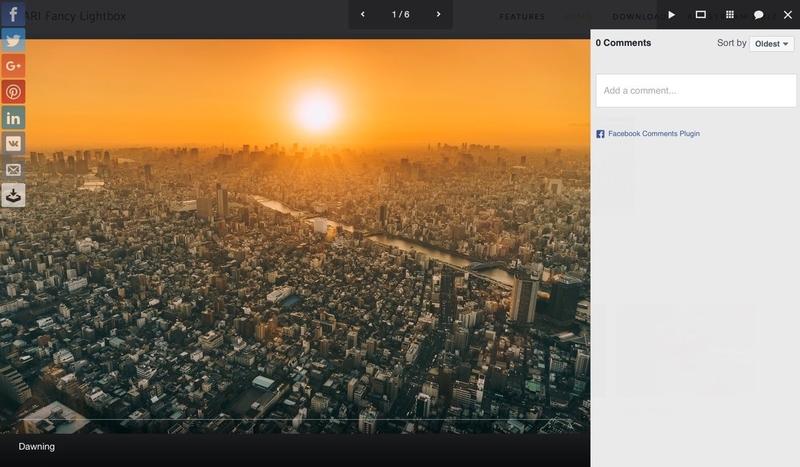
A client dashboard in WordPress is a dedicated page where clients can view key data related to their projects, campaigns, or performance. Instead of sending reports back and forth, you give them one place to check updates whenever they need to.
Think of it as a live reporting hub. It organizes important information in a way that is easy to scan and understand, which saves time for both you and your client.
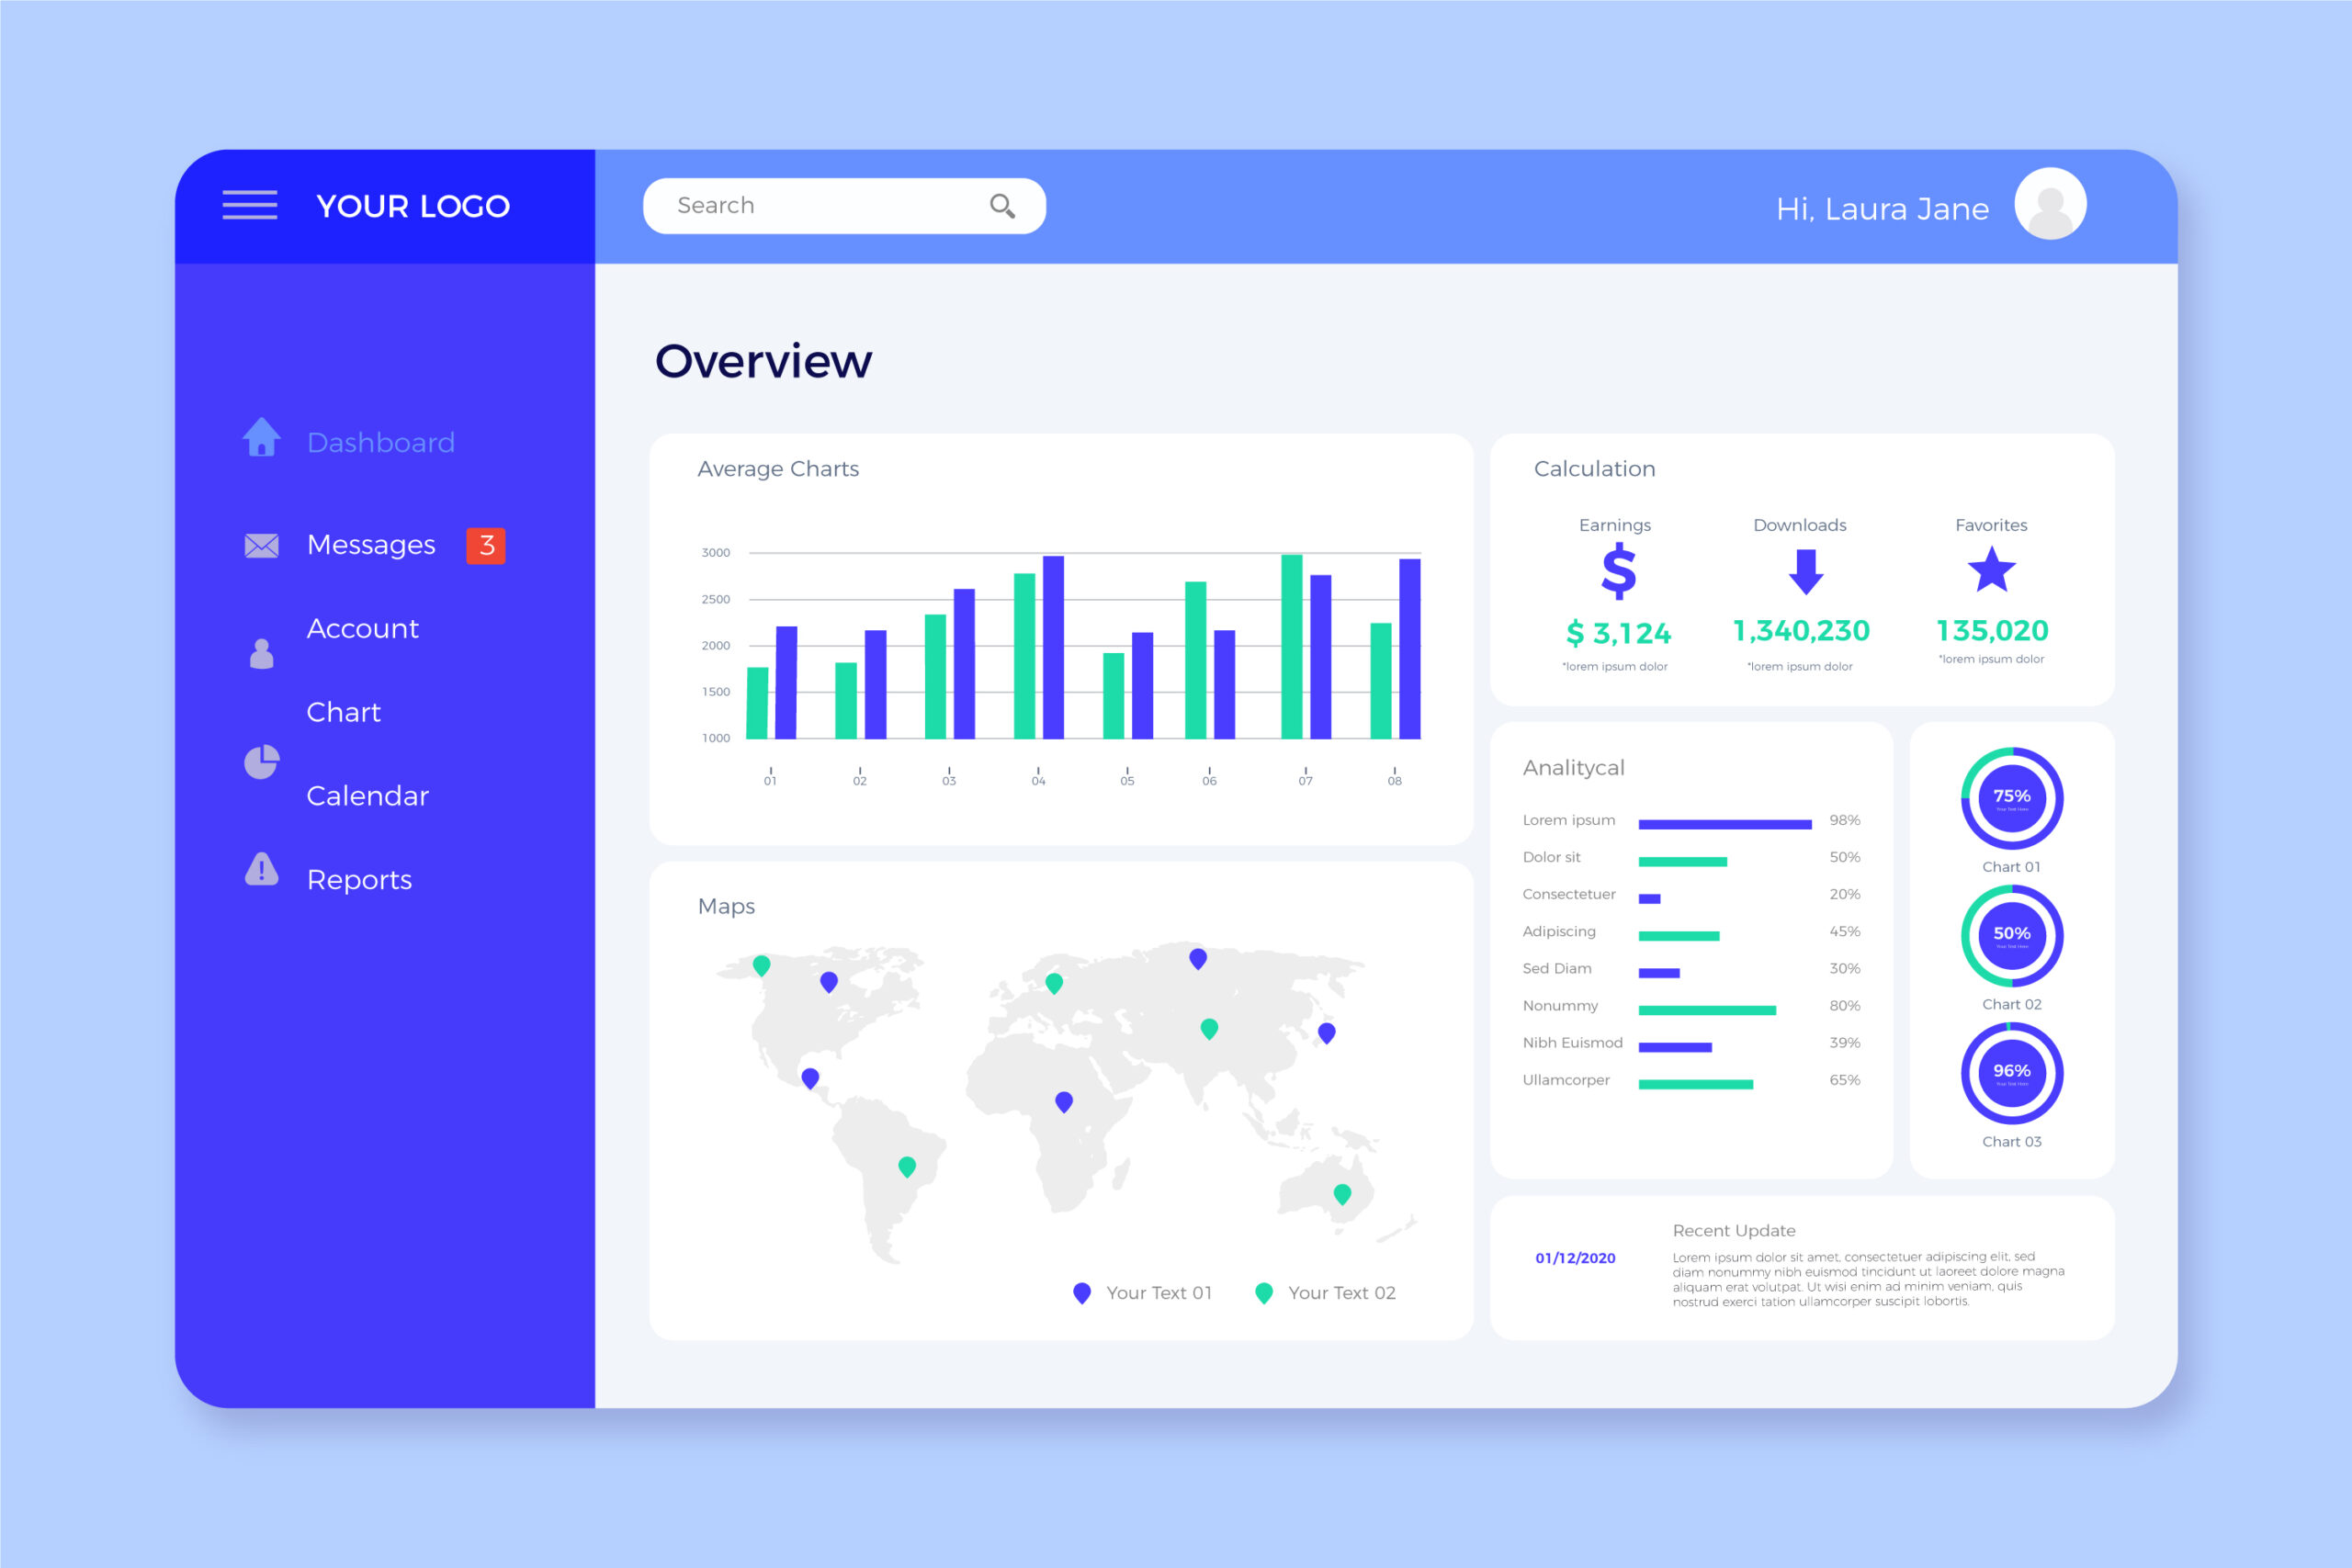
A typical client dashboard includes:
- Performance metrics: traffic, conversions, revenue
- Campaign data: ad performance, email results, SEO rankings
- Project updates: tasks completed, milestones, timelines
- Notes or insights: explanations of what the data means
The exact setup depends on the type of work you do, but the goal stays the same: to turn complex data into something clients can understand quickly. A good dashboard makes reporting clearer, improves transparency, and keeps communication simpler.
Why Use Tables for Client Dashboards?
Tables work well for client dashboards because they make information easier to scan. Instead of forcing clients to read long reports, you can show the most important data in a format they already understand.
They also make dashboards easier to manage. Metrics stay aligned, updates are easier to add, and clients can compare changes over time without digging through separate reports.
Interactive features make tables even more useful. Sorting, filtering, and searching help clients find what matters faster, without needing extra explanation.
Key benefits
- Clarity: Data is easy to read and understand.
- Organization: Metrics stay structured and consistent.
- Scalability: Tables handle both small and large datasets.
- Flexibility: You can include a variety of information, including numbers, text, links, and notes.
- Interactivity: Sorting, filtering, and searching improve usability.
What You Need Before You Start
Before you build a client dashboard, make sure you have the basics in place. The setup is much easier when your WordPress site is already running smoothly, and you have full control over how the dashboard will be managed.
You should have a self-hosted WordPress site with admin access, properly configured user roles, and enough familiarity with WordPress to create and edit pages.
It is also important to think through the data before you start building. A dashboard is only useful if the information inside it is clear, relevant, and up to date. That means knowing where your data comes from, which metrics matter most, and making sure everything is organized before you add it to the dashboard.
Depending on your setup, that data may come from tools like Google Analytics, ad platforms, CRM systems, or spreadsheets. You may also want to use spreadsheet software to prepare the data first, along with a table plugin to display it clearly inside WordPress.
Once those pieces are in place, the dashboard itself becomes much easier to build and maintain.
Step-by-Step: How to Build a Client Dashboard in WordPress
Building a client dashboard in WordPress does not require advanced development skills. If you break the process into clear steps, you can create something that is simple, useful, and easy for clients to navigate. Start with the basics, then improve the dashboard over time as your needs grow.
Step 1: Define what your client needs to see
Start with the end user. Ask yourself what your client actually cares about.
Avoid the urge to “data dump” into the dashboard. Instead, focus on a small set of meaningful metrics.
Common examples include:
- Website traffic
- Conversions or leads
- Revenue or sales
- Campaign performance
- Project progress
The goal is to answer one question: What does success look and feel like for this client?
Step 2: Structure your data
Once you know what to show, organize it into a logical format. Tables will work best when the data is grouped clearly.
A simple structure might include:
- Date
- Metric name
- Value
- Change from the previous period
- Notes or insights
Keep it consistent. When your structure stays the same, clients will adopt it quickly.
Step 3: Create a table
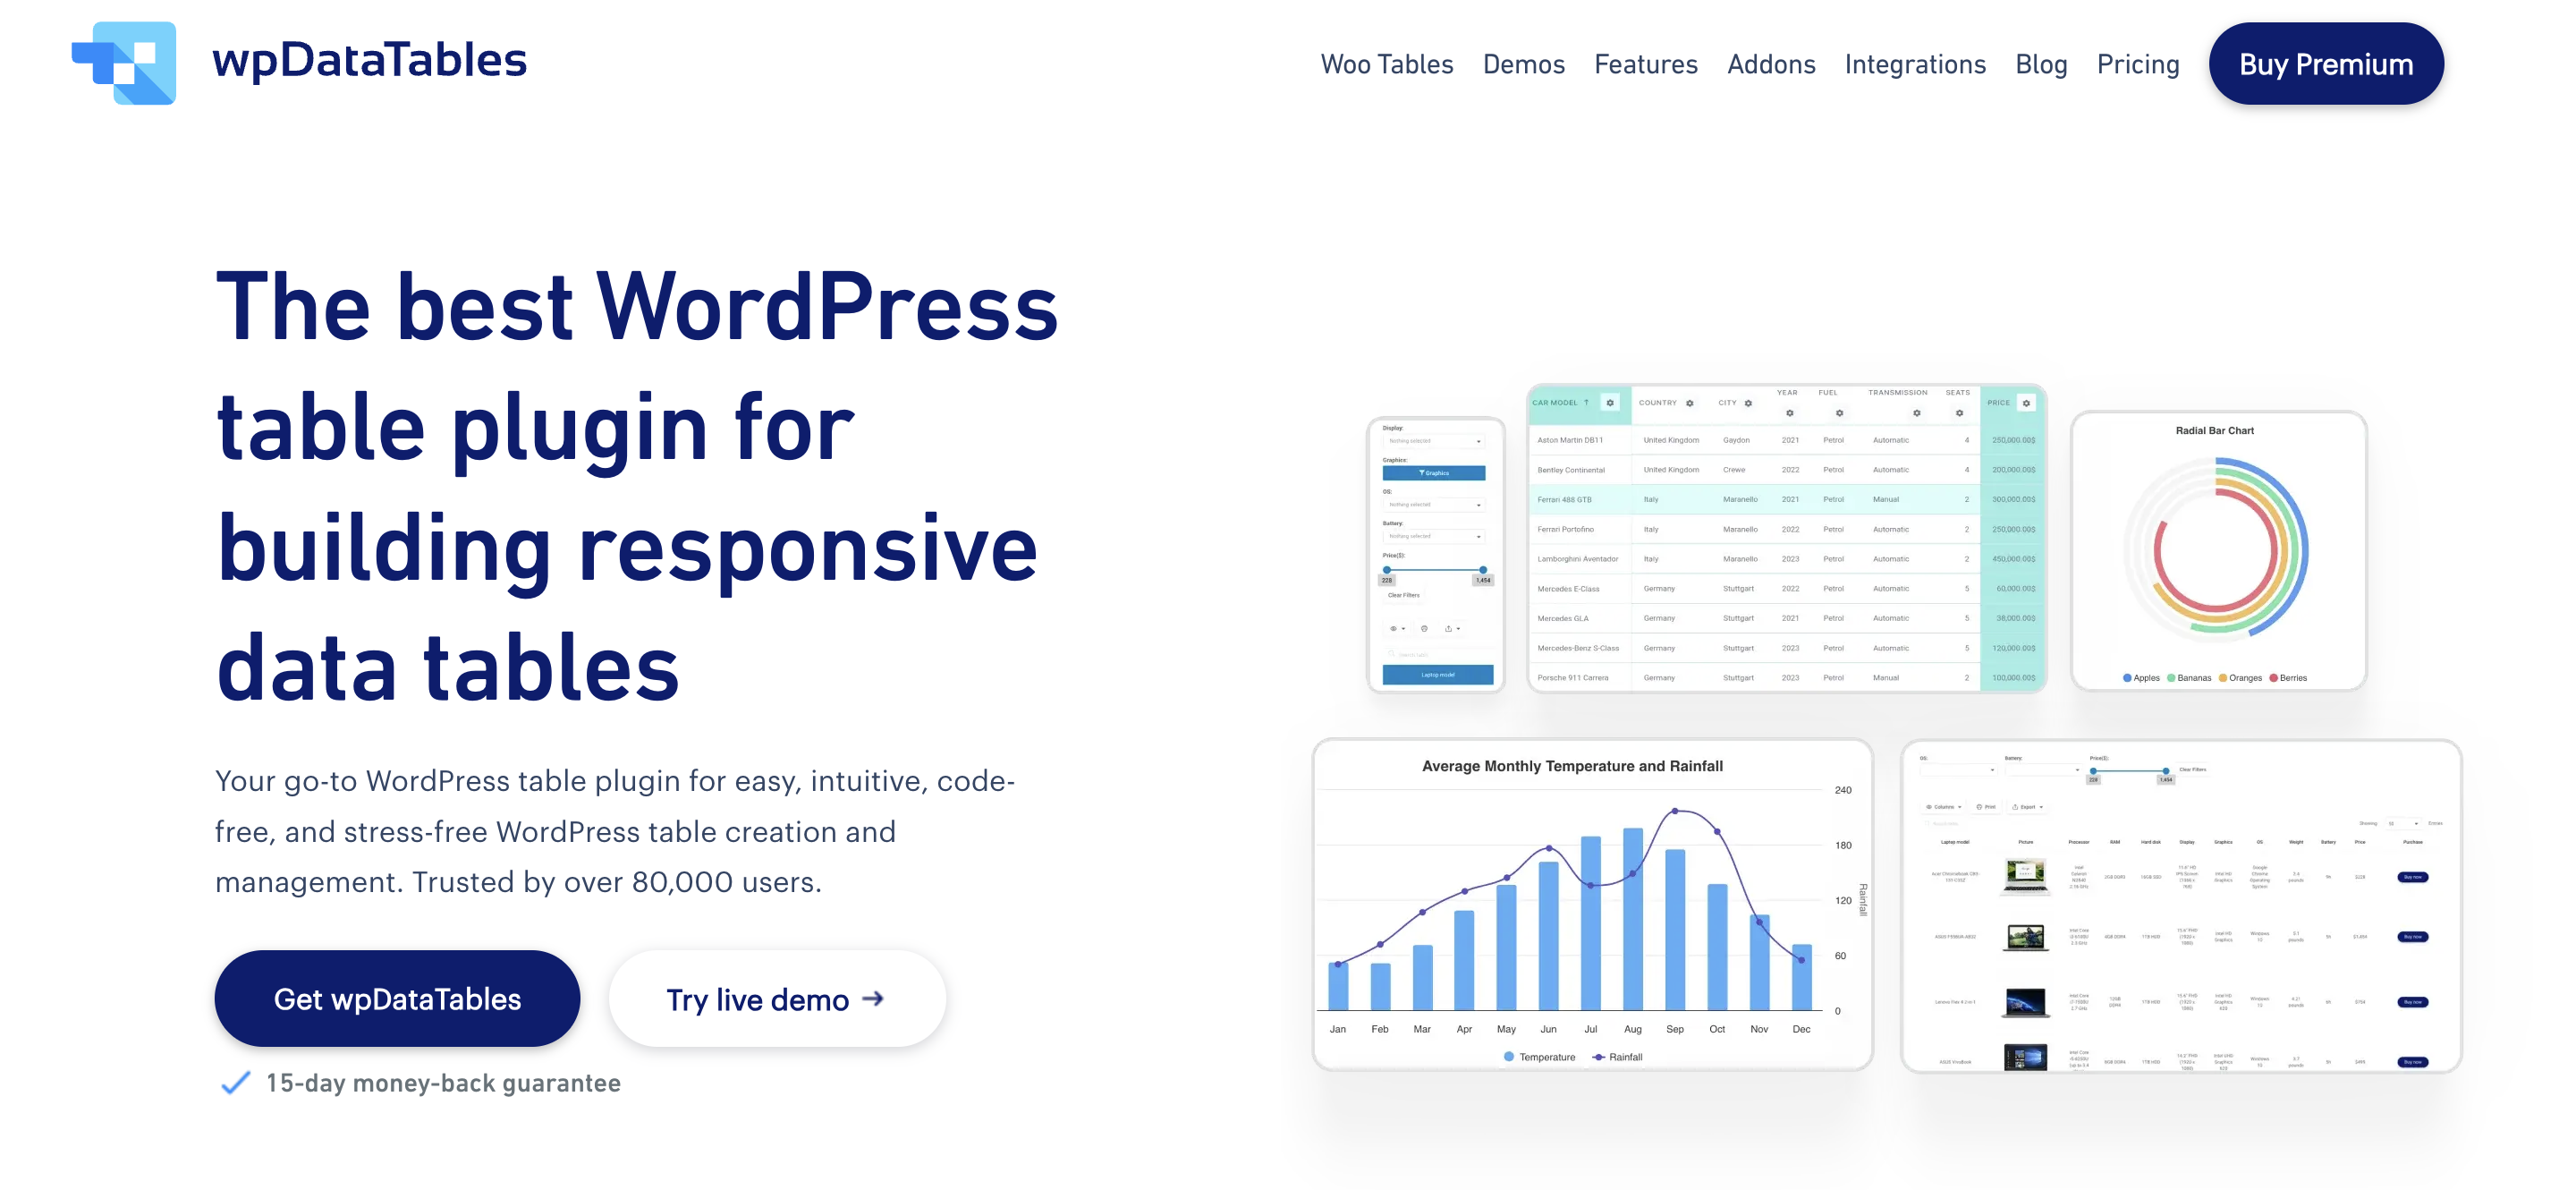
Now it is time to build the tables that will power the dashboard. This is where a table plugin can make the process much easier. Instead of formatting everything manually, you can use a tool like wpDataTables to create structured tables that are easier to manage, update, and display inside WordPress.
As you build:
- Use clear column labels.
- Keep formatting simple.
- Align numbers for easy comparison.
- Avoid overcrowding the table.
The goal is to make it readable. If a client cannot understand the table at a glance, simplify it.
Step 4: Add interactivity
Static tables can do the job, but interactive tables make the dashboard much easier to use. When clients can sort columns, filter data, and search for specific information, they can find what they need without asking you to walk them through it every time.
Step 5: Embed tables into a dashboard page
Create a dashboard page for each client and add the tables and summary information that are relevant to their work. The page should be easy to follow and not overloaded with too much detail at once. A simple structure usually works best: begin with the key metrics, then move into more detailed tables, and add short notes where extra context is helpful.
Keep the layout clean and easy to scan. Clear headings and enough spacing between sections help clients find what they need without confusion.
Step 6: Control access for clients
Not every client should be able to see every dashboard, so access needs to be set up carefully. In WordPress, that can mean using user roles, membership features, or password-protected pages to make sure each client only sees the information meant for them.
This is especially important when the dashboard includes sensitive business data. Clear access controls help protect client privacy and keep the setup organized as you manage more accounts.
Step 7: Keep the dashboard updated
A dashboard is only useful if the data is kept current.
You can update data in two ways:
- Manual updates: simple but requires regular effort
- Automated updates: connects to data sources for real-time syncing
Choose the method that fits your workflow best. Even simple dashboards provide value if they stay consistent and up to date.
Use Cases: Who Needs Client Dashboards?
Client dashboards are not limited to one type of business. Any service that involves ongoing work, performance tracking, or reporting can benefit from a clear, centralized view of data. If your clients regularly ask for updates, a dashboard can replace those conversations with a more efficient approach.
The exact setup may look different from one business to another, but the goal is the same: give clients a simple way to see progress, understand results, and stay informed without constant back-and-forth.
Here are a few common use cases:
- Freelancers: Track deliverables, timelines, and completed work.
- Marketing agencies: Show campaign performance, leads, and ROI.
- SEO specialists: Monitor keyword rankings, traffic, and backlinks.
- Consultants: Share progress against goals and strategic milestones.
- Developers: Display project status, feature releases, and timelines.
- Finance professionals: Track budgets, expenses, and forecasts.
For example:
- A marketing agency uses a dashboard to show ad performance each week.
- An SEO consultant tracks keyword movement over time.
- A developer updates clients on project milestones.
Why Dashboards Improve Client Relationships
A client dashboard does more than display data. It changes how you work with clients. Instead of responding to constant update requests, you give clients a clear place to check progress at any time.
This reduces friction in communication. Clients feel more in control because they can access information on their own, and you spend less time answering repetitive questions. Both sides stay aligned without the need for frequent meetings.
Dashboards also help set clear expectations. When everyone sees the same data, it becomes easier to track progress and make decisions quickly. There is less confusion and fewer misunderstandings.
Most importantly, dashboards build trust. Consistent visibility shows clients that work is being done and results are being tracked. Over time, that transparency leads to stronger relationships, longer engagements, and more referrals.
Turning Dashboards Into a Business Opportunity
Once you start building dashboards for clients, you are doing more than reporting data. Instead of sending reports, you offer access. That shift creates a more premium experience and opens the door to recurring revenue.
You can position dashboards in different ways, including:
- As part of a monthly service package.
- As an add-on for existing clients.
- As a standalone reporting solution.
- As a productized service with fixed pricing.
As you take on more clients, this becomes a real business. You manage client data, handle contracts, and deliver ongoing services.
At that point, it is worth thinking about structure. Many freelancers choose a Limited Liability Company (LLC) to separate personal and business activity. While researching how to set this up, you may come across discussions about how to pick the best state for your LLC, especially as your client base grows.
You will also need a few basics in place:
- Employer Identification Number (EIN): for payments, taxes, and banking
- Registered agent: to handle legal and government communication
In reality, a simple dashboard can turn into a scalable service. And with the right setup, it becomes a steady and structured business.
Best Practices for Creating an Effective Dashboard
A good dashboard is about showing the right data in the right way.
Firstly, keep it simple. Too much information creates confusion and diminishes the dashboard’s value. Focus on a small set of key metrics that directly relate to the client’s goals.
Consider these best practices:
- Prioritize key metrics: Highlight the most important ones first.
- Use consistent formatting: Keep tables and labels uniform across the dashboard.
- Add context: Include short notes that explain what the data means.
- Update regularly: Outdated data reduces trust quickly.
- Keep navigation simple: Make it easy to find information.
Also, think about how your client will use the dashboard. A marketing client may check performance weekly, while a developer’s client may only look at milestones. Design your dashboard around real usage, not assumptions.
A Simple Dashboard Will Transform How You Work
A client dashboard turns scattered data into something clear and useful. Instead of sending reports and answering constant questions, you give clients a simple way to see progress whenever they need it. That alone can change how you work day to day.
When you build dashboards with tables, you keep things organized, scalable, and easy to understand. Start simple, focus on the right metrics, and improve over time.
As you take on more clients, dashboards can grow into a real service offering. With the right structure and systems in place, you can turn a simple reporting tool into a reliable and scalable part of your business.