Bogdan Radusinovic

Bogdan Radusinovic

Senior SEO and Marketing Specialist

Experienced SEO specialist which uses research and analysis to improve websites ranking on search engines.

Real-Time Data Visualization Best Practices To Follow

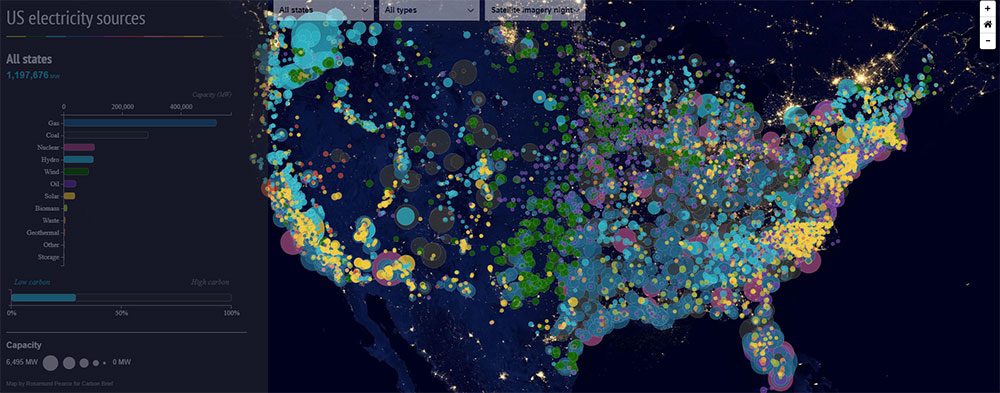
Real-time data visualization is like watching a high-speed train of data, but you’re the conductor, seeing everything in live action. It’s not just numbers and charts; it’s about bringing data to life.

Think about all the different places you see data. In businesses, real-time data visualization is like a superhero. It swoops in and shows what’s happening at that very second. It’s super useful in healthcare, finance, and heck, even sports! Imagine doctors tracking patient stats in real-time or businesses monitoring sales during a big promo. It’s all about making quick, smart decisions.

Decision-making? More like decision-nailing with real-time data visualization. It’s like having a crystal ball, but for data. You see trends, patterns, and whoopsies as they happen. No waiting around. You spot an issue, and bam, you’re on it like lightning!

Now, this is where it gets even cooler. Interactive dashboards and live data analytics are like playgrounds for your fingers. Swipe, tap, zoom – you’re exploring data like never before. It’s not just looking; it’s discovering stories hidden in the numbers.

How to Identify and Use Different Types of Data

Let’s dive into a topic that’s pretty crucial but often overlooked – understanding different types of data. We’re surrounded by data everywhere, in this digital era, and it’s like the backbone of modern business insights.

Whether you’re crunching numbers for a market analysis or predicting the next big trend in data science, knowing your data types is like having a secret weapon.

Imagine data types as different flavors in a chef’s kitchen. Each type has its unique taste (or in our case, use) and knowing which flavor to use can make or break a dish (or a data project). From the bustling world of digital business to the intricate workings of statistics and market research, data types are the silent heroes.

Data types come in two main categories – qualitative and quantitative.

Think of qualitative data as the descriptive, more subjective type. It’s like the color commentary in a sports match, adding context and color.

Quantitative data, on the other hand, is all about numbers and measurements – the scoreline of the match, if you will. Both types are critical in decision-making and data analysis.

They’re like the yin and yang of the data world, each playing a unique role in painting the full picture.

Best Software and WordPress Black Friday Deals in 2023

As the anticipation for Black Friday builds with the approaching holiday season, a surge of irresistible deals and discounts awaits. Beyond traditional physical products, this occasion holds immense value for WordPress enthusiasts, developers, and business owners aiming to fortify their digital realm.

Advantages of Secondary Data in Data Visualization

Imagine crafting a killer website without checking out others in your niche first. Sounds risky, right? In the world of business, data is like the compass guiding our ship. But not just any data – I’m talking about the kind that’s easy to grab, time-efficient, and budget-friendly. Enter secondary data.