TablePress Alternatives That Could be Better For You
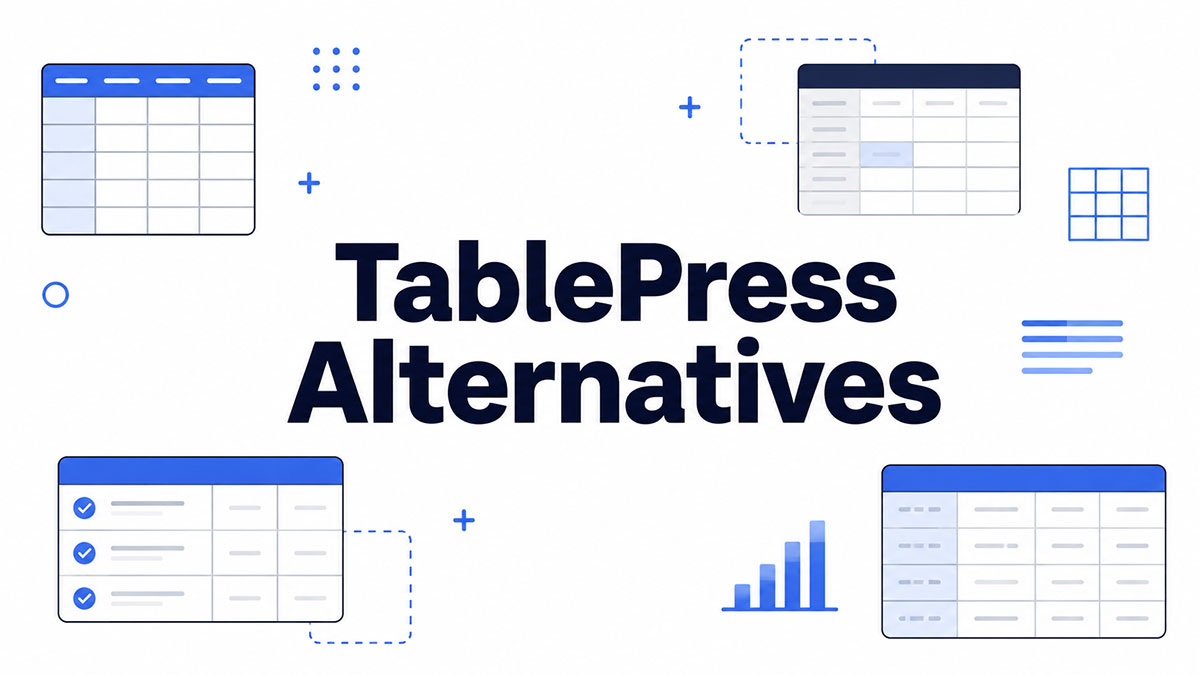
Everything works fine until the dataset grows. Then you’re watching 10,000 rows crawl across the screen, with no charts, no live data, and a plugin that won’t stretch any further. That’s usually the point where people start looking for TablePress…