Data should answer questions, not create more of them.
If your visitors have to scan hundreds of rows to find one useful number, the table isn’t working. If they can’t filter, sort, or summarize what they’re seeing, they’re guessing instead of deciding.
Static tables don’t fail because the data is wrong. They fail because they don’t help people understand the information. Moreover, WordPress sites aren’t just digital brochures anymore. They’re dashboards, directories, resource hubs, and reporting tools.
That’s where wpDataTables makes the difference: it turns raw data into something people can actually use.
Table of Contents
The Problem with Static Data
Most tables on WordPress sites start in a spreadsheet. They’re exported, embedded, and published. The data is technically available, but it’s static.
There’s no easy way for visitors to narrow results, reorder information, or focus only on what matters to them. As datasets grow, usability drops. What looks structured at first quickly turns into endless scrolling and manual searching.
Static tables treat every visitor the same. Everyone sees the same rows, in the same order, with the same limitations. But users don’t come with the same questions. Some want to compare values. Some want totals. Others are looking for one specific entry.
Without interaction, even accurate data becomes difficult to use.
From Overwhelm to Clarity: Making Data Easy to Navigate
When data feels overwhelming, the issue usually isn’t the volume — it’s the lack of control.
Users shouldn’t have to work through a table line by line to find what matters to them. They should be able to reorganize it or narrow it down within seconds. That’s the shift from static to interactive. Instead of forcing everyone to consume data the same way, you give visitors tools to shape the view around their own questions.
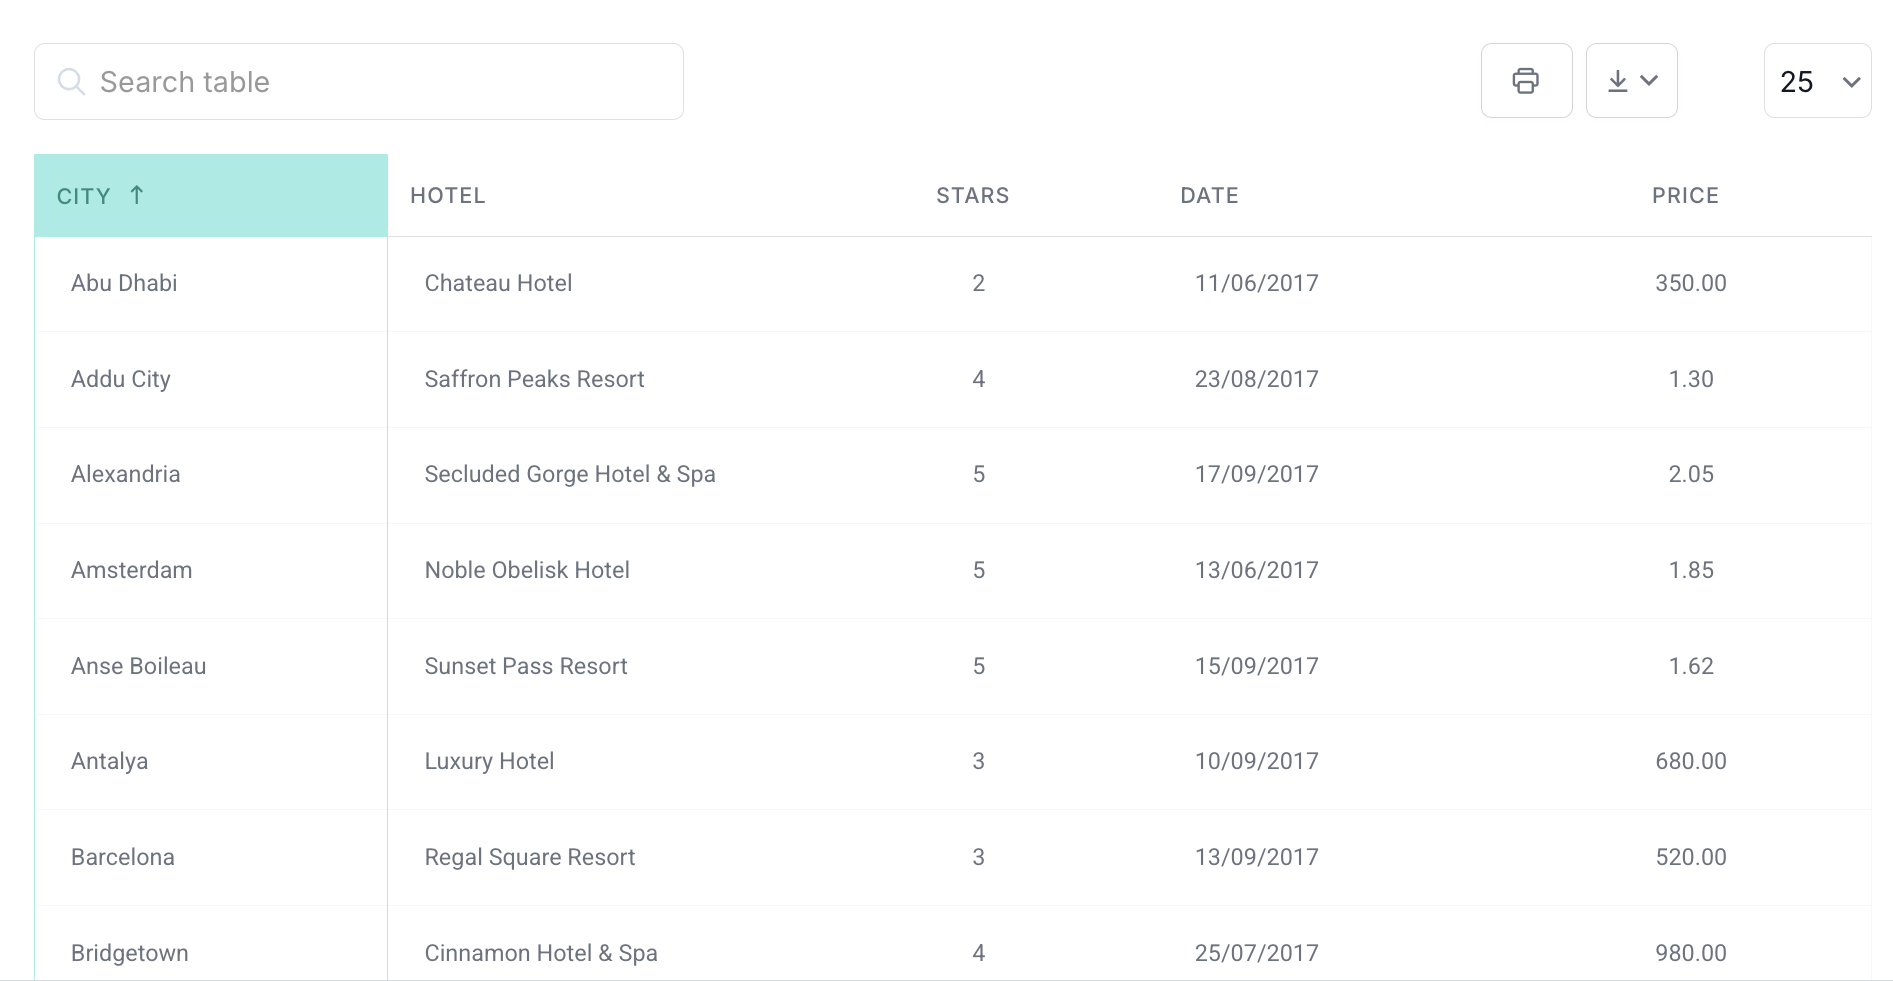
Sorting: find what matters instantly
Sorting is simple, but it’s powerful. Imagine finding exactly what you are looking for without spending hours scanning the tables.
With just a click on a column header, users can instantly reorganize data in ascending or descending order. Whether they want the highest values, the lowest prices, the newest entries, or an alphabetical list, the table adapts immediately.
This makes comparison easier and patterns more visible. Instead of passively reading through rows, visitors actively bring the most relevant information to the top.
In wpDataTables, sorting helps turn large datasets into a structured, searchable, and far more practical format.
Advanced filtering: let users ask their own questions
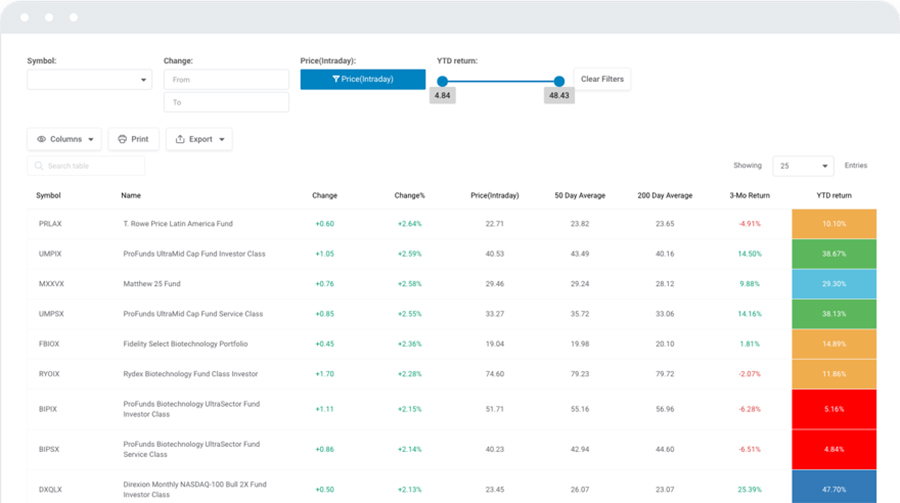
Instead of endless scrolling, let your visitors refine what they see with advanced filters. They can narrow data by column values, for example, showing only products within a certain price range, entries containing a keyword, or records from specific dates.
Filters can be combined, so users can apply multiple conditions at once. Want to see all entries where the stock is below 50, the release date is from March 2024 to April 2025, and the category is either Electronics or Home Appliances? Done — instantly.
With intuitive input types like dropdowns, date pickers, numeric ranges, and text fields, even complex queries are simple for end users. The table updates immediately, turning raw data into a tool for exploration.

Pre-filtering tables via URL: share specific insights
Sometimes you want visitors to see a table already narrowed down to a specific view. wpDataTables makes this easy with URL-based pre-filtering. You can create a single table and share multiple links that each open it pre-filtered by a chosen value.
To do this, simply add a special key to the page URL, like ?wdt_search=filtervalue, where filtervalue is the entry you want to filter by. When visitors open the link, the table automatically displays only the relevant data.
This is perfect for sharing targeted insights, directing users to specific subsets of data, or creating multiple “views” of the same table without duplicating it. This way, your visitors get the information they need, without extra clicks or manual filtering.
Spot Trends Instantly
Big tables are great, but spotting patterns in rows of numbers can be tricky. Thankfully, that’s where wpDataTables shines. Important values, trends, or outliers can be highlighted automatically, so top performers, low stock, or overdue dates are available at a glance.
This makes it easy for visitors to focus on what really matters without getting lost in endless rows. Patterns become clear, and decisions can be made faster. Your tables stop being just a list of numbers; they become tools for action.
Conditional formatting: highlight what matters
Big tables can be overwhelming, but what should you do if you have a lot of data to present? Conditional formatting highlights key values, making important numbers and trends immediately visible, so users can focus on what matters without scrolling endlessly.
For example, imagine you want to quickly see which products are underperforming, which sales figures are unusually high, or which deadlines are approaching. Color cues or visual markers bring those numbers to the forefront without any manual searching.
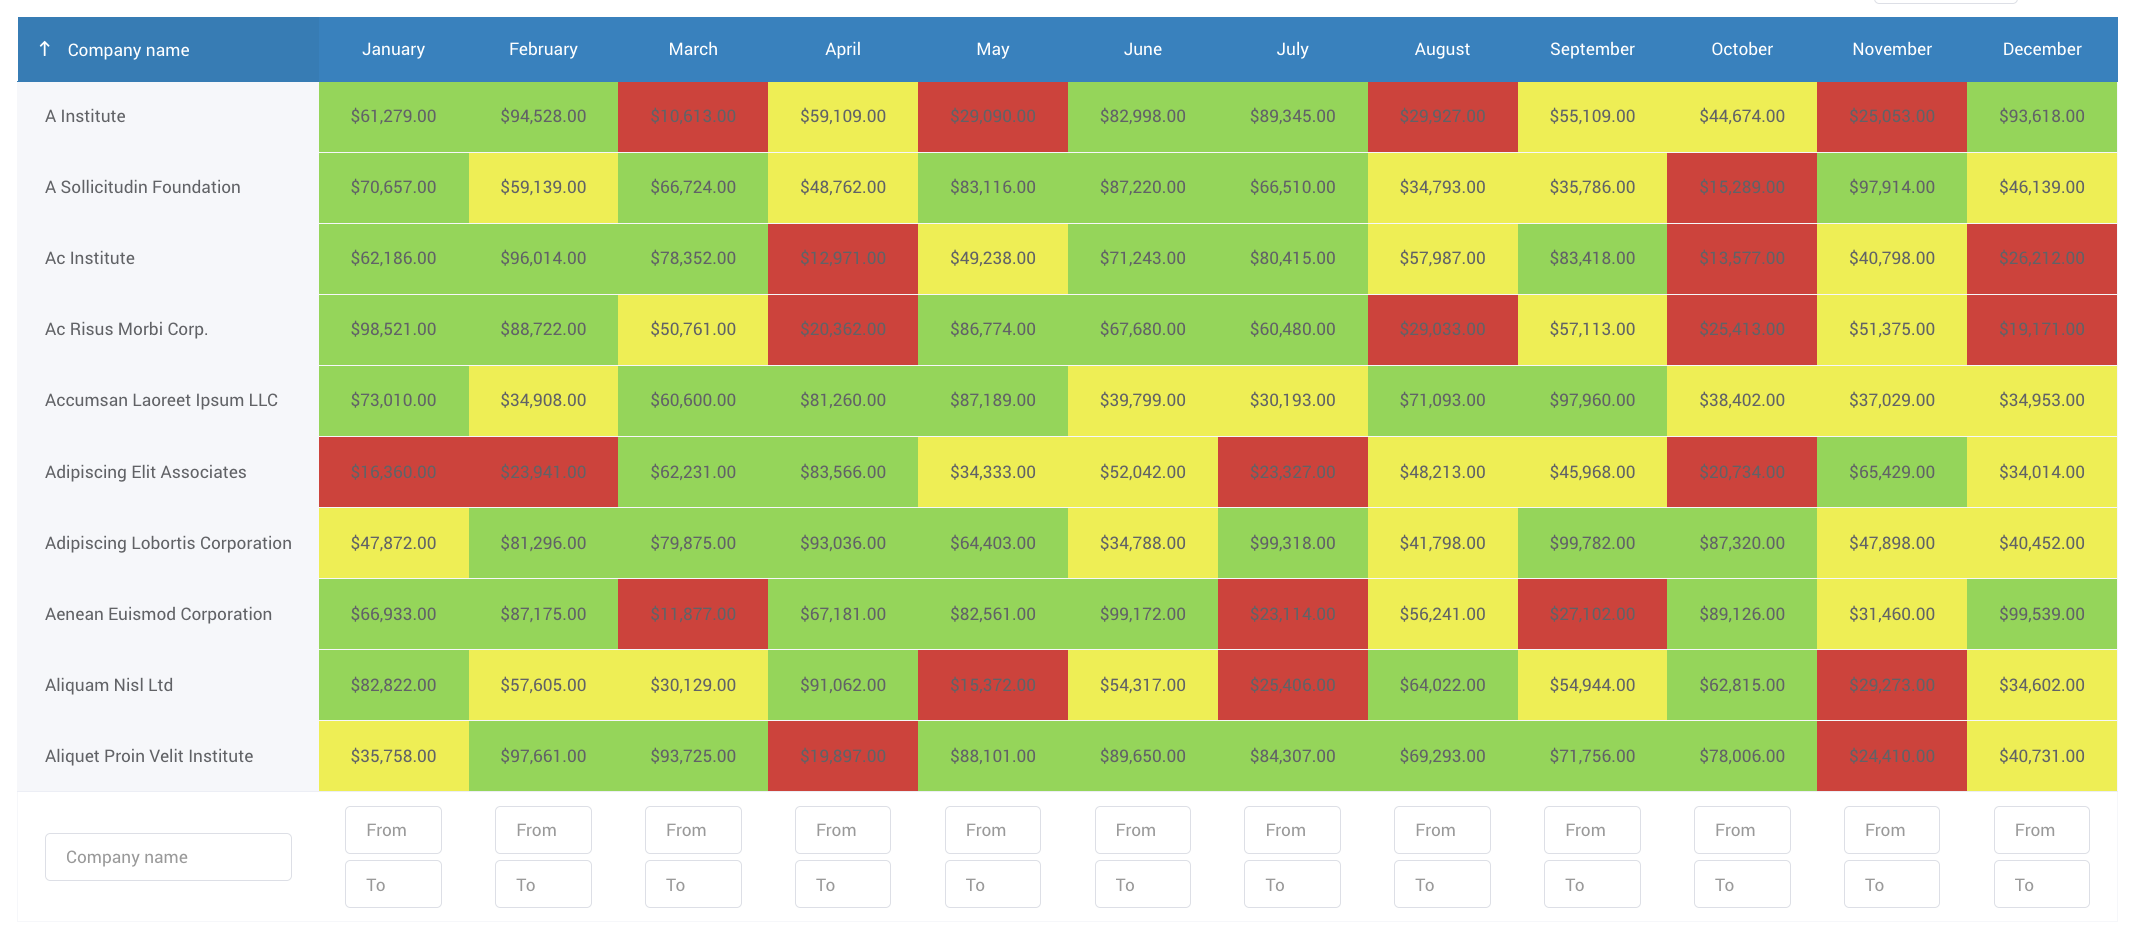 By drawing attention to critical data points, you eliminate the need to go through each cell manually. All you need is laid right in front of you and colored accordingly.
Transform value: make raw numbers human-friendly
Raw numbers and data are useful, but they don’t always tell the full story. Making values easier to interpret helps users understand and act on the information faster.
With the transform value feature in wpDataTables, you can customize how table values are displayed. Numbers, emails, links, images, and attachments can all be transformed to show more meaningful or interactive content. For example, email addresses can become clickable links, URLs can open directly in a new tab, and images can be displayed inline — all without changing the underlying data.
This transforms tables from static spreadsheets into interactive, human-friendly resources. Visitors can immediately recognize actionable items or interact with data without extra steps, making your tables both informative and usable.
Turning Tables into Analysis Tools
Why not turn your every table into an interactive analysis tool? After all, what’s the point of having data if it just sits there, too hard to interpret? Tables can be made easier to navigate and genuinely useful for anyone who needs to work with the data.
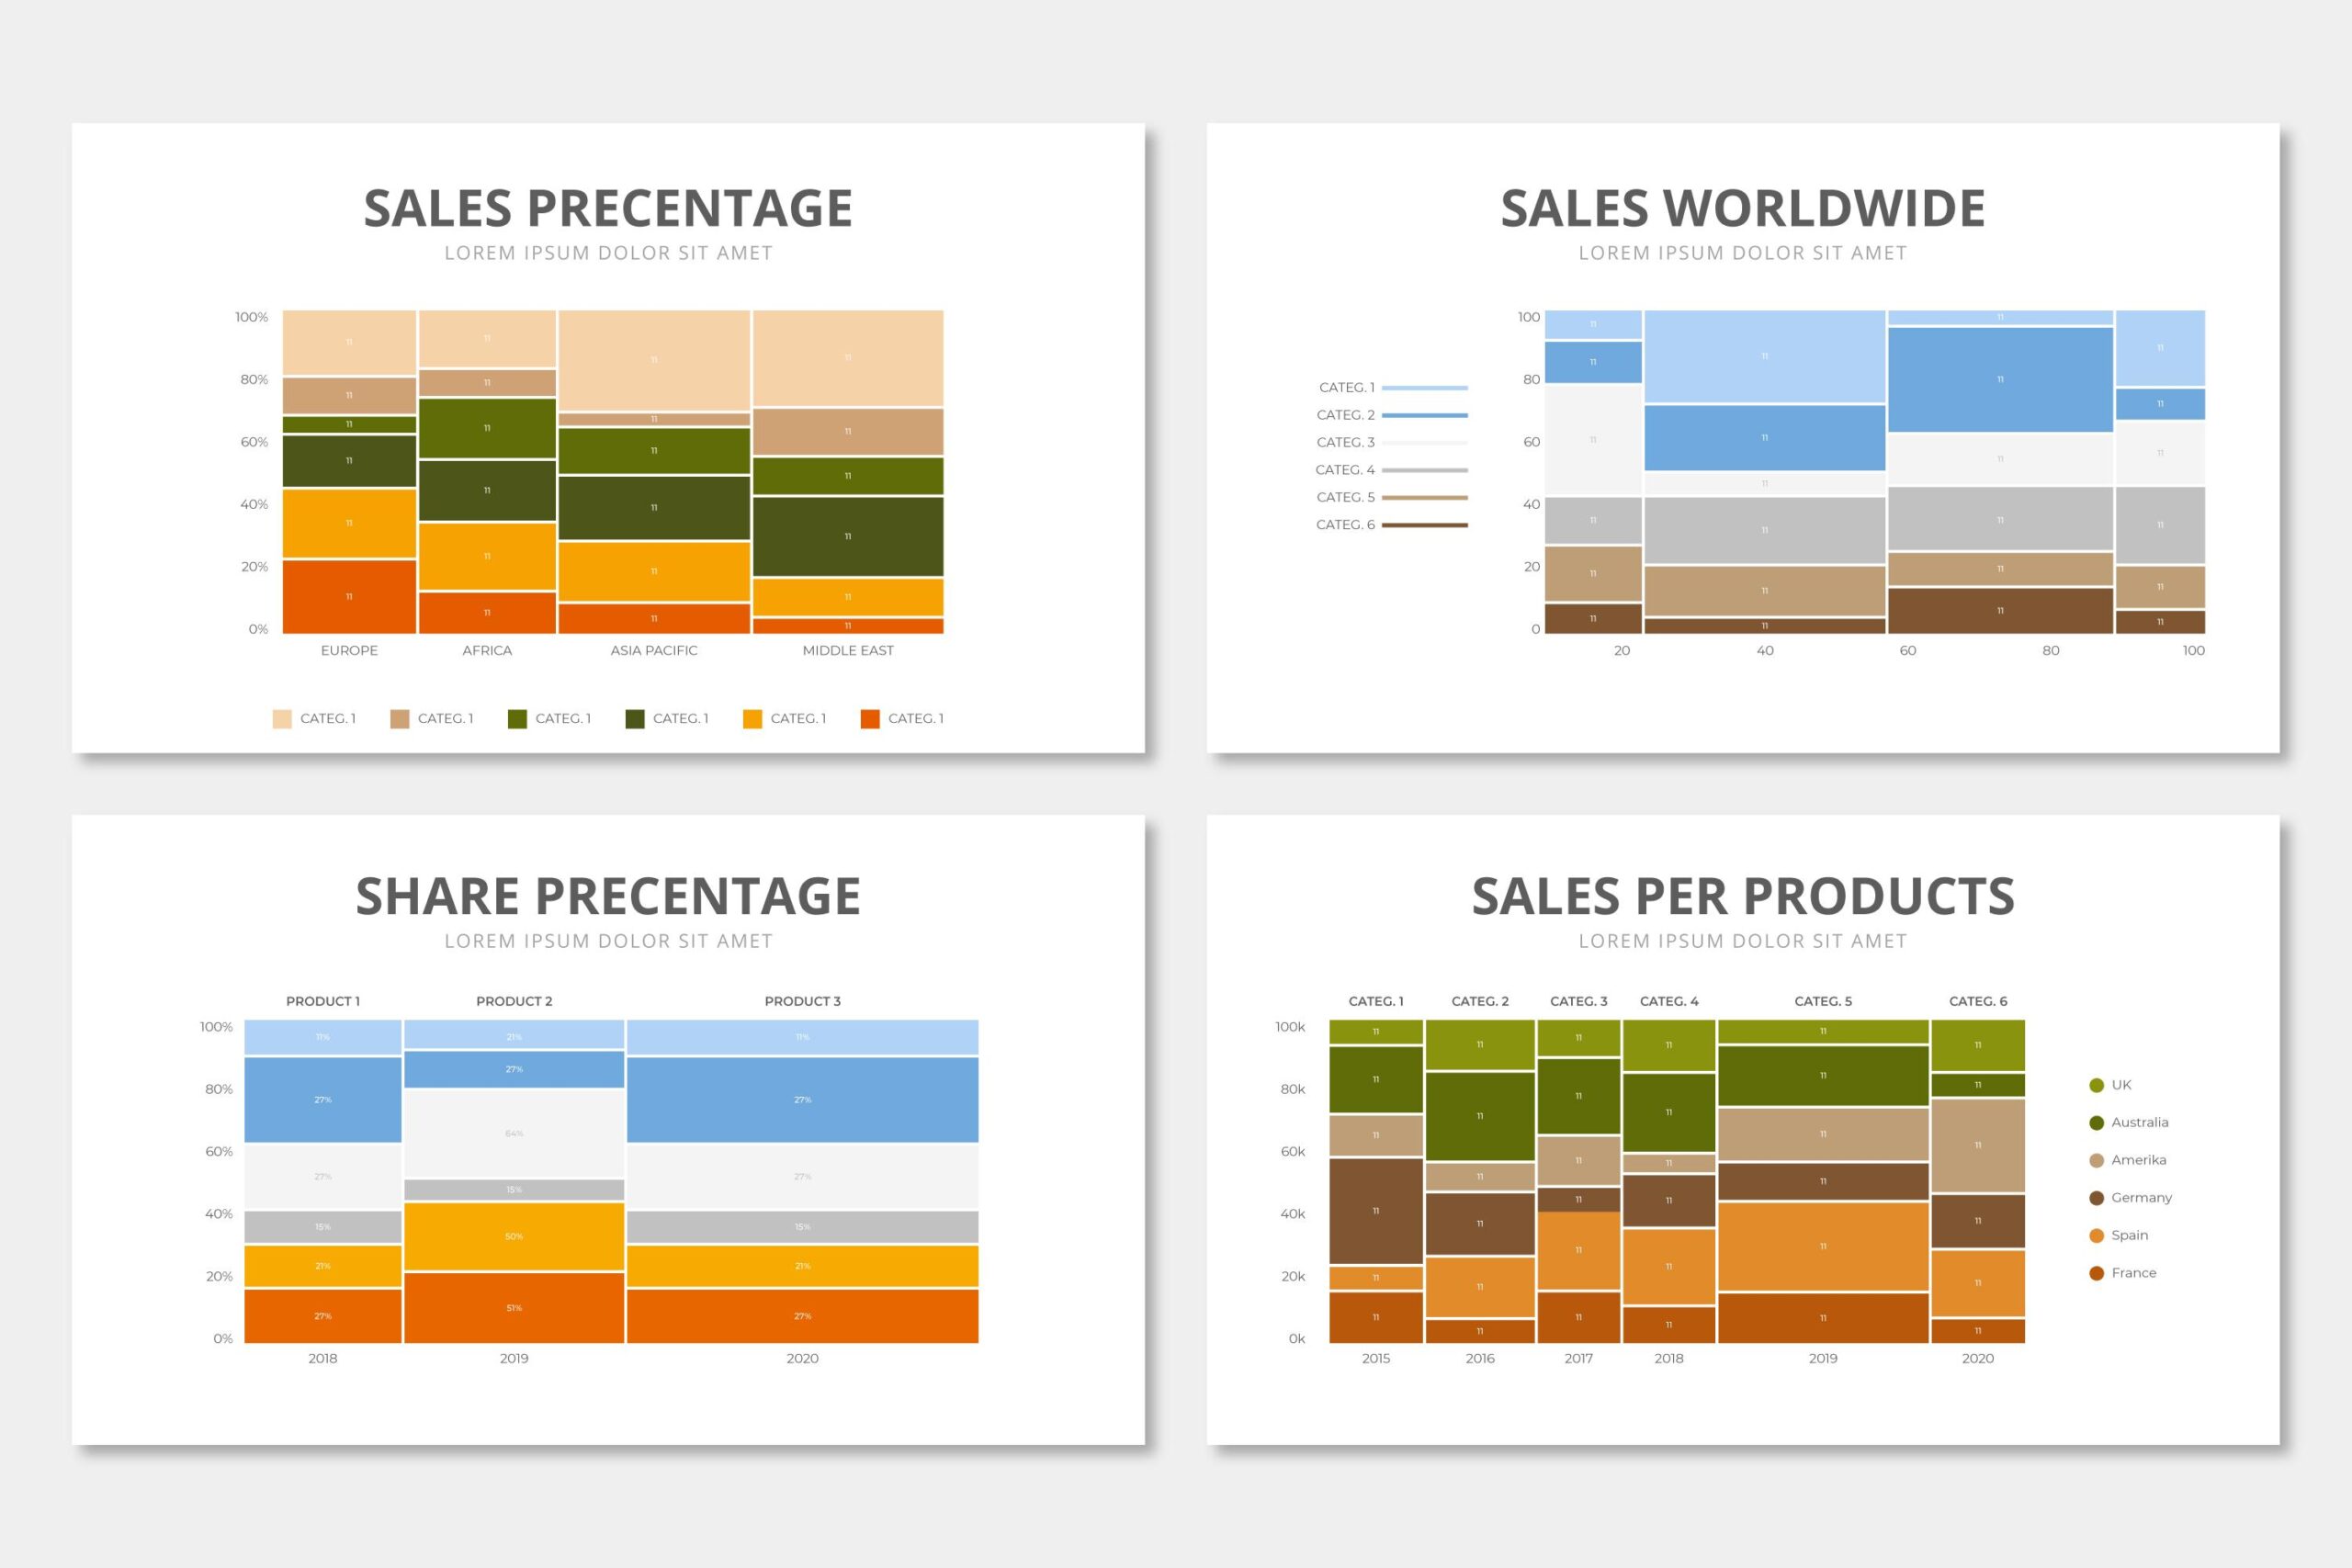
Row grouping: see the bigger picture
Grouping rows by shared attributes makes large datasets much easier to understand. It lets users quickly compare related items and spot trends without getting lost in rows.
Whether you’re organizing products by category, employees by department, or sales by region, this approach gives raw data a clear, structured view. It makes large tables more approachable and drawing conclusions much easier.
Calculating totals for columns: instant summaries
Want to make data analysis faster and more accurate? Enabling users to sum column values and calculate averages, minima, and maxima gives instant clarity.
Sometimes all you need are quick summaries, like total sales for a month, the combined price of products in an order, maximum profit, minimum wage, or average grades. Instead of calculating these manually, the calculating totals feature does it automatically for your numeric columns.
Set it up once, and you can sit back and enjoy the summed-up data without extra effort.
Hidden columns: keep data powerful but clean
Sometimes tables include extra information that’s important behind the scenes but doesn’t need to be seen all the time. Hidden columns let you store this data in the table without cluttering the view. Users interact only with the visible columns, while hidden ones handle calculations, automatic values, or metadata in the background.
For example, imagine a product inventory table. You might let users see and edit the product name and stock quantity, while hidden columns automatically store the product ID, supplier info, or cost price. These fields don’t appear in the table initially, but the data is still stored and can be revealed if needed.
This keeps tables clean and focused while maintaining full functionality. Users see only what’s relevant, but the hidden data quietly powers calculations, filters, or summaries, giving you the best of both worlds.
How It Works in the Real World
These features turn ordinary tables into tools that are useful for both site owners and visitors. Admins can set up tables with sorting, totals, hidden columns, and conditional formatting to organize and summarize large datasets. On the frontend, visitors can interact with what’s made available — filtering, sorting, and exploring the data that’s relevant to them.
Together, they make even complex tables easy to navigate. Users see clear, focused information, while the underlying data remains structured and fully functional for analysis behind the scenes.
Who benefits the most?
E-commerce businesses
Tables help customers find products quickly and compare options, while owners can track sales, inventory, and key metrics efficiently.
Restaurants and food services
Menus, nutritional info, or ingredient lists can be presented in interactive tables that let visitors sort by dietary needs, price, or category.
HR departments and employee management teams
Staff directories or performance tables on internal portals can be interactive, searchable, and focused on what employees need to see.
SaaS and tech companies
Feature comparisons, pricing tiers, or support resources can be presented in interactive tables, making it easier for users to understand options.
Event management companies
Tables for conferences, workshops, or ticket availability allow attendees to find sessions, dates, and pricing quickly.
Real estate agencies
Property listings can be displayed in sortable, filterable tables, helping potential buyers or renters find the right match quickly.
And the list doesn’t stop there — virtually any business can benefit, because if you can display a table on your website, you might as well make it fully functional.
Conclusion: Data That Works for You
Data should do more than sit there. It should guide, inform, and spark action. With wpDataTables, your tables stop being static and start working.
Every table can become a living tool. Visitors find what they need quickly, trends become obvious, and insights emerge without extra effort. Ultimately, whatever kind of data you have, it can finally show its value.