Bogdan Radusinovic

Bogdan Radusinovic

Senior SEO and Marketing Specialist

Donut Charts: The Ultimate Guide

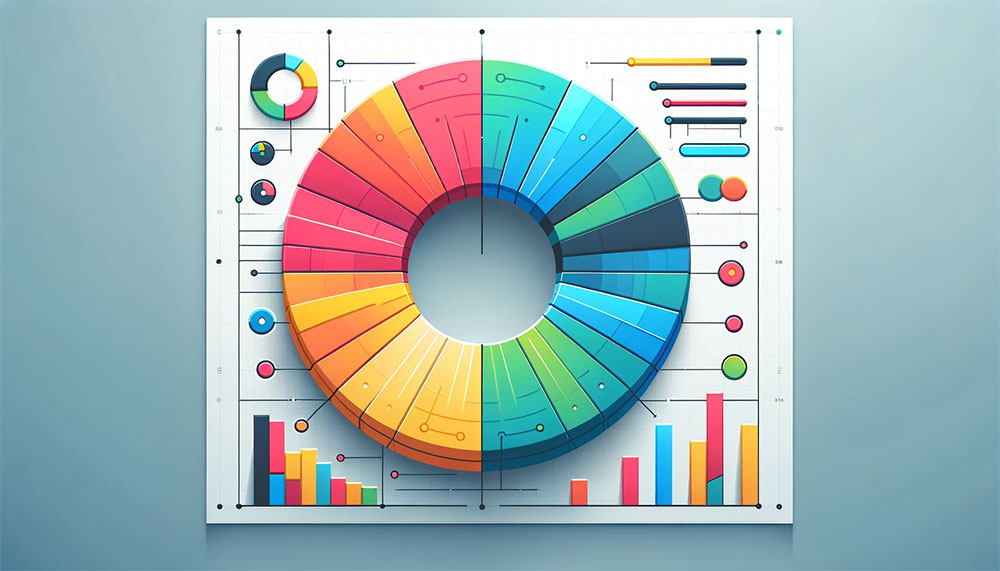
Donut charts are an indispensable tool for anyone serious about data visualization. These charts, an offshoot of pie charts, offer a clear graphical representation of data distribution while maintaining a sleek design that resonates with both business analytics and casual…

What is Text Data Visualization and When to Use It

Understanding what text data visualization can achieve is key to turning complex text data into clear insights. In a world brimming with textual information from social media, surveys, and documents, visualizing this data isn’t just beneficial—it’s essential for effective data interpretation and text analytics. We’ll…