Imagine you’re staring at a treasure chest, but instead of gold, it’s brimming with raw data. To make sense of the chaos, the secret lies in types of data tables.
These aren’t just any storage units but the backbone of informed decision-making. Whether crafting intricate pivot tables to streamline your database management or harnessing cross-tabulation for in-depth data analysis, your mission is clear.
You’re about to embark on a quest to unravel the mysteries of organizing and presenting facts and figures. I’ll guide you through the maze of tabular data formats, from the simplicity of flat files to the dynamic world of Tableau reports and beyond.
Your takeaway? A wealth of data organization prowess. You’ll be nailing chart creation like a pro and optimizing spreadsheet design for maximum impact.
Ready to become a maestro of data manipulation? Buckle in. We’re diving deep into the art of slicing, dicing, and presenting information that makes sense of the numbers that power our world.
Table of Contents
The Types of Data Tables
Textual Data Tables
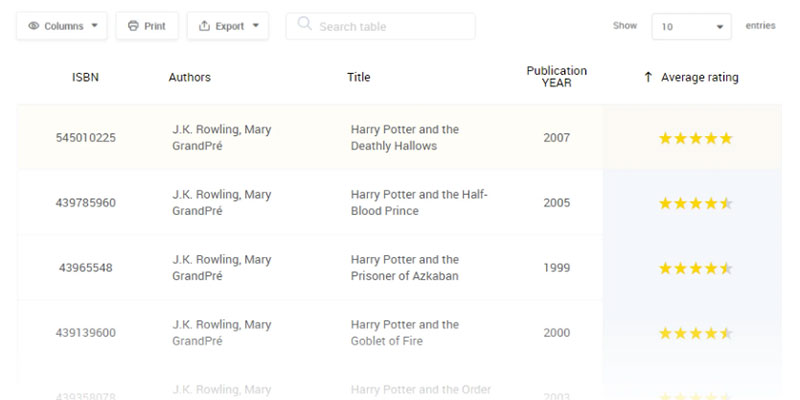
Let’s start with the first on our list – textual data tables. These are the kind of tables that handle a whole lot of words.
Think of an article database, where you have titles, authors, publication dates, and maybe a short description.
Textual data tables are like the bookworms of data tables, always lost in words. They shine in scenarios where the main content is non-numerical.
Like, when you want to show a list of blog posts with details about the author and publish date, or a directory of employees with their names, emails, and job titles.
Designing textual data tables isn’t just about plopping text into cells. Nope. You’ve got to make it easy to scan and comprehend. Here are a few tips:
- Keep it minimal: Avoid wordy cells. Break information into separate columns if needed.
- Alignment matters: Left align your text. It’s easier on the eyes and supports our natural reading flow.
- Zebra striping: Consider using alternating row colors. It’s easier to follow a line of text without getting lost.
Numerical Data Tables
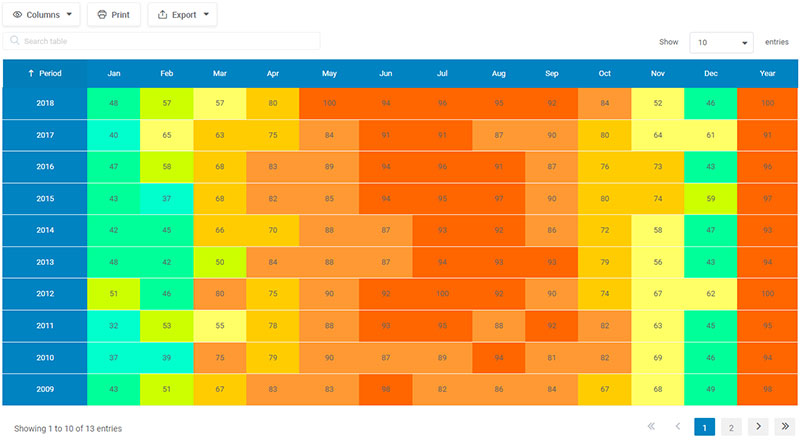
Next up, numerical data tables. These tables are all about numbers. They’re like the mathematicians of data tables, always crunching digits.
You’ll see these guys a lot in financial reports, sales data, or anywhere you’ve got a bunch of numerical data to show.
For example, if you’re showing a product list with prices, ratings, and available stock, or perhaps a sports scoreboard showing team rankings, player stats, and scores. Numerical data tables handle it like a boss.
Designing numerical data tables has its own set of rules. Here’s the lowdown:
- Right align numbers: It makes comparing figures easier.
- Highlight important figures: Using bold or color can help important numbers stand out.
- Provide summary rows: Totals or averages at the bottom or top can give a quick overview of the data.
Mixed Data Tables
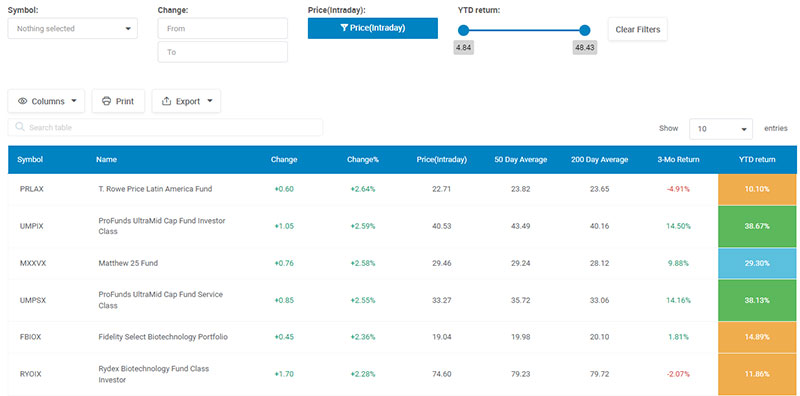
Last but not least, mixed data tables. As the name suggests, these tables are the cool kids that handle both text and numbers. They’re versatile and flexible, adapting to various scenarios where you’ve got a mix of data types.
Imagine a table showing an inventory of products, with names, descriptions, prices, and stock levels, or a table showing a list of students, their ID numbers, courses, and grades.
For mixed data tables, you need to balance the best practices for both textual and numerical tables.
Keep it simple, keep it clear, and consider how users will interact with the data. And most importantly, always put the user first.
Your table is only as good as it is usable.
Free Chart Type Picker
Designing Effective Data Tables
Cool, now that we know about the different types of data tables, let’s level up.
Understanding User Needs
Good design is about understanding the user. Period. When it comes to data tables, your users aren’t interested in how fancy your table looks. They care about finding the information they need.
Once you understand the users’ needs, you can start designing data tables that are not just usable, but also a pleasure to interact with.
Considerations for Data Table Design
Now, here are some points to consider:
- Simplicity: Don’t overwhelm users with too much information.
- Consistency: Consistent design makes your table easier to understand. Stick to a single style.
- Responsiveness: Your table should look and function well on any device. Make sure it’s responsive.
Elements of a Table: Data, Columns, and Rows
A data table has three key elements: data, columns, and rows.
- Data: The data you display should be relevant, clear, and easy to understand.
- Columns: Each column should represent a specific type of information.
- Rows: These are the individual items or units. Each row should represent a single data record.
Types of Data and Their Presentation
The type of data you have determines how you present it.
- Textual Data: Keep it concise, use clear labels, and align text to the left.
- Numerical Data: Right align numbers for easy comparison, and highlight important figures.
- Mixed Data: Balance the needs of textual and numerical data. Make it simple and clear.
Column and Row Management
Handling columns and rows can be tricky. Here’s a quick run-down:
- Adding and removing columns: Be selective about what you show. More isn’t always better.
- Ordering of columns: Put the most important columns where they’re easiest to see, like at the beginning.
- Row height: Keep rows tall enough to be legible and clickable, but short enough to show as much data as possible.
Viewing Options and Customization
Lastly, consider offering viewing options and customization. Letting users adjust the table to their needs can vastly improve their experience.
Think about allowing users to show or hide columns, sort data, or filter results.
Your beautiful data deserves to be online
wpDataTables can make it that way. There’s a good reason why it’s the #1 WordPress plugin for creating responsive tables and charts.

And it’s really easy to do something like this:
- You provide the table data
- Configure and customize it
- Publish it in a post or page
And it’s not just pretty, but also practical. You can make large tables with up to millions of rows, or you can use advanced filters and search, or you can go wild and make it editable.
“Yeah, but I just like Excel too much and there’s nothing like that on websites”. Yeah, there is. You can use conditional formatting like in Excel or Google Sheets.
Did I tell you you can create charts too with your data? And that’s only a small part. There are lots of other features for you.
Enhancing Data Table UX
UX in data table design is all about making sure users can easily find, understand, and use the data they need. It’s about making your data table not just usable, but also intuitive and efficient.
So, what does good UX look like in a data table?
Here are some examples:
- Clear Column Headers: Make sure users know exactly what each column represents. Keep headers short, clear, and concise.
- Clickable Rows: If rows lead to more details, make it obvious. Maybe change the cursor on hover, or highlight the row.
- Hover Effects: Speaking of hover, consider showing more options or details when a user hovers over a row or cell. It’s a great way to keep the interface clean yet informative.
Row and Column Styles
How your rows and columns look can also have a big impact on UX.
Here are a couple of tips:
- Zebra Striping: Alternating row colors can make it easier to follow a line of text. It’s a small change that can make a big difference.
- Column Width: Make sure your column widths match the content. Too narrow, and data might get cut off. Too wide, and you’re wasting space.
Navigation and Interaction
How users navigate and interact with your data table is another key part of UX. Consider these points:
- Pagination or Infinite Scroll: If you’ve got a lot of data, showing it all at once might be overwhelming. Break it up with pagination or infinite scroll.
- Sorting and Filtering: Let users sort columns or filter data. It can make finding specific data a whole lot easier.
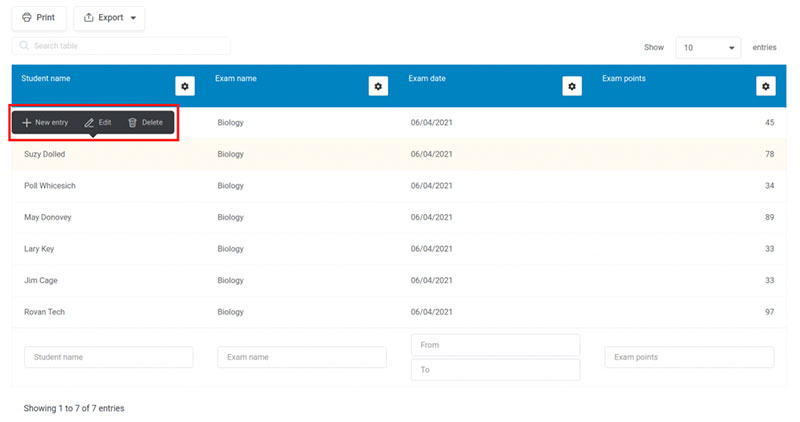
Table Actions and Feedback
Lastly, consider how users perform actions and get feedback. Here’s what to think about:
- Action Buttons: If users can perform actions like editing or deleting, make these options clear and easy to use.
- Feedback Messages: If an action was successful, or if something went wrong, let the user know. Clear feedback is crucial.
Advanced Data Table Features
Search, Sort, and Filter Functions
- Search: A quick and simple search bar allows users to pinpoint the exact piece of data they’re looking for.
- Sort: Let users sort data in ascending or descending order to organize the data to their liking.
- Filter: Filters can help users narrow down the data. Think of it like a more advanced search function. Users can filter by category, status, date range, you name it.
Multi-select and Bulk Actions
Sometimes, users need to perform actions on multiple items at once. This is where multi-select and bulk actions come in.
- Multi-select: Let users select multiple rows at once. It can be as simple as adding checkboxes next to each row.
- Bulk Actions: Once users have selected multiple rows, they’ll need to do something with them. Provide options like bulk delete, bulk edit, or bulk export.
Inline Editing
Inline editing is another neat feature which we have in wpDataTables as well. It lets users click on a piece of data and edit it right there in the table.
No need to go to a separate edit page or pop-up. It’s all about making it fast and effortless for the user.
Expandable Rows and Additional Information Display
Finally, expandable rows. This feature allows users to click on a row to reveal more information.
It’s a great way to keep the interface clean while still providing all the necessary details.
FAQ on Data Tables
What’s the Deal with Pivot Tables?
Pivot tables are a game changer, right? I always say they’re the superheroes of data analysis. Imagine having the power to reorganize, sort, and sum up data with just a few clicks. A spreadsheet transform into a living, breathing, telling-you-what-to-do-next kind of thing. Magic!
Can I Use Different Data Tables in Excel?
Of course, Excel’s like a playground for data geeks. You’ve got your simple lists, your comparison charts, all the way to those complex pivot tables. There’s a variety for every kind of data need. Master these, and you’re basically the wizard of spreadsheets.
Why Choose a Cross-Tabulation?
Well, cross-tabulation is like having that insider info—you know, the scoop. It lets you see the relationship between two variables at a glance. Super handy for market researchers or when you’re trying to get why sales spiked last July.
What Makes a Good Data Table?
Good data tables speak clearly. No mumbles. No jargon. They got rows and columns labeled like champions, data sorted just right, and visuals that make your point pop. Clarity, it’s the name of the game.
How Do I Design a Table for Better Data Visualization?
Design—oh, it’s everything. Keep it clean, make sure it’s not crowded, and let’s not forget, colors help but don’t overdo it. Contrast is your friend. And yeah, highlight the key stuff, so it’s more like, “Bam, here’s what you gotta know!”
What Types of Data Tables Are Best for Statistical Analysis?
Statistical analysis? Yeah, you’ll want contingency tables or correlation matrices. These pals help spot patterns or relationships in numerical data. Basically, they’re how the pros turn number soup into insights stew.
How Does Data Table Formatting Impact Data Interpretation?
The right formatting? Like reading a book that’s been properly edited. Wrong formatting is like, “What the heck am I looking at?” Legibility leads to accuracy, which leads to making sense of those numbers before your second cup of coffee.
What’s the Role of a SQL Table in Database Management?
SQL tables, they’re the brick and mortar of database management. They handle data in a structured, searchable, and, let’s say, elegant way. Without ’em, your database is like a library without shelves.
How Important Are Data Entry Conventions to Data Tables?
Data entry sounds boring, right? But conventions are the unsung heroes. They keep the chaos at bay. Stick to a system, and suddenly you’re not drowning in data. You’re surfing it.
When Should I Consider Using Interactive Data Tables?
Interactive data tables shine when you want to give people the steering wheel—to explore, to play with data, to get what they need on-the-fly. They’re perfect when static just won’t cut it—think dashboards, real-time reports, or anything that’s gotta speak now and fast.
Conclusion
In wrapping up, the journey through the types of data tables isn’t just a stroll—it’s an expedition. It’s all about finding the right vessel to navigate the sea of data. Each table type, be it a sleek pivot table or a sturdy SQL table, plays its part in the grand schema of things.
They’re not just containers; they’re storytellers. They translate the binary into the extraordinary, turning row upon row of data into compelling narratives. From the way data visualization tools bring pixels to life to how database management keeps the digital cogs turning smoothly, it’s clear: tables are pivotal.
Whether for insights that drive growth, or data organization that fuels efficiency, it’s these unsung heroes that bring clarity to chaos. So, take what you’ve learned, and wield it well. Remember, behind every great decision… is a well-organized table.
If you enjoyed reading this article about the types of data tables, you should also check out this one about interactive data visualization.
We also wrote about a few related subjects like misleading data visualization examples, data visualization tools, data visualization color palette examples, data visualization best practices, and data visualization examples.


