
Histograms are essential for data visualization, making it easier to understand frequency distributions and statistical patterns.
When it comes to presenting histogram examples, knowing how to create, interpret, and apply these charts is crucial for any effective data analysis.
The purpose of this article is to equip you with a solid understanding of histograms, through numerous examples and practical applications.
By the end, you will be able to leverage histograms for data insights, improve your skills in statistical analysis, and utilize various tools like Excel, R, and Python for constructing these graphical representations.
We will delve into the components of histograms, the importance of frequency distribution, and useful tips for data bins and class intervals. We’ll also examine how to identify skewness in a histogram, and understand population distribution.
Ready to transform your data analysis capabilities? Let’s explore some compelling histogram examples that demonstrate the power of this statistical tool.
Table of Contents
Histogram Examples
Histogram created with wpDataTables


Your beautiful data deserves to be online
wpDataTables can make it that way. There’s a good reason why it’s the #1 WordPress plugin for creating responsive tables and charts.

And it’s really easy to do something like this:
- You provide the table data
- Configure and customize it
- Publish it in a post or page
And it’s not just pretty, but also practical. You can make large tables with up to millions of rows, or you can use advanced filters and search, or you can go wild and make it editable.
“Yeah, but I just like Excel too much and there’s nothing like that on websites”. Yeah, there is. You can use conditional formatting like in Excel or Google Sheets.
Did I tell you you can create charts too with your data? And that’s only a small part. There are lots of other features for you.
FAQ On Histograms
What is a histogram?
A histogram is a type of data visualization that displays the frequency distribution of a dataset. It uses bars to represent the frequency of numerical data within specified ranges, known as bins or class intervals.
Frequencies are counted, making it easier to interpret large datasets and identify trends.
How do I create a histogram?
Creating a histogram involves three main steps: collecting your data, determining the bin size, and plotting the frequencies.
Tools like wpDataTables, Excel, R, and Python can make this process straightforward. Each software has built-in functions that guide you through the creation and customization of your histogram.
Why are histograms useful?
Histograms help in understanding the distribution and spread of numerical data. They enable data analysts to visualize data clusters, patterns, and outliers at a glance.
This graphical representation can reveal insights into data that are not obvious from raw numbers alone.
What are the components of a histogram?
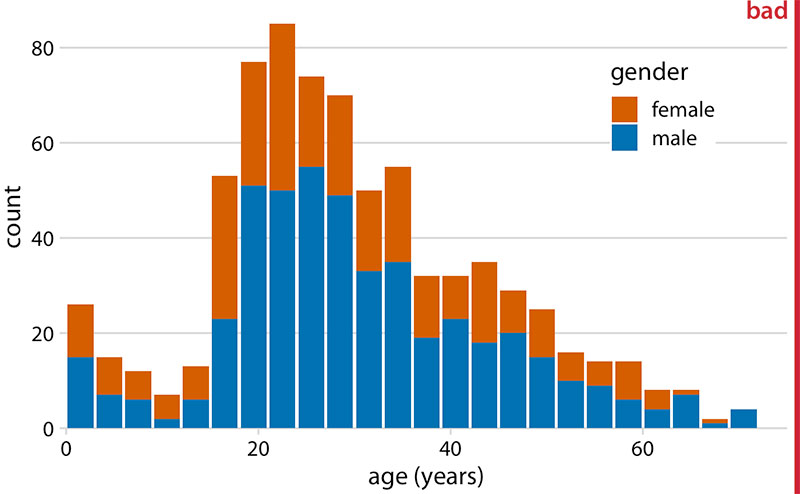
A histogram typically contains an x-axis representing the data range, a y-axis showing the frequency count, and bars to represent these frequencies.
Other components may include data labels, titles, and legends to enhance clarity. Understanding these parts is essential for accurate interpretation.
How do you interpret a histogram?
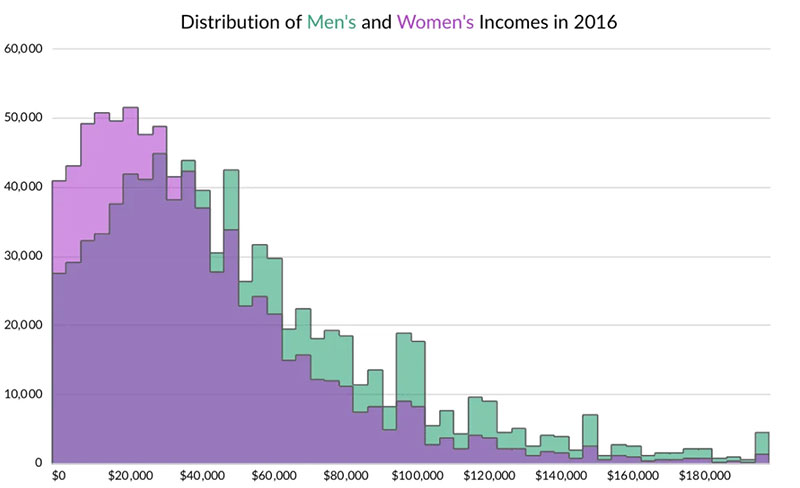
Interpreting a histogram involves analyzing the shape of the distribution, identifying patterns, and noting any skewness.
For example, a bell-shaped curve indicates normal distribution, whereas a skewed histogram suggests data is not evenly distributed. This can inform your data analysis and decision-making processes.
What types of data are best suited for histograms?
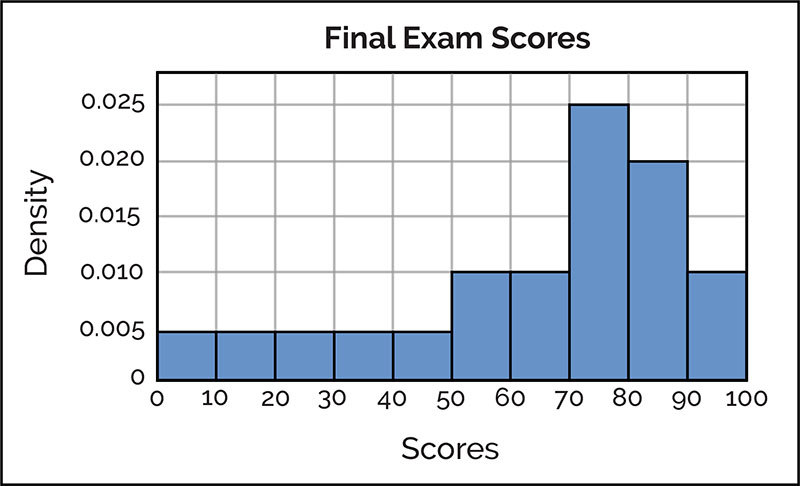
Histograms are best suited for continuous numerical data. Examples include age, height, and test scores.
Grouped data in class intervals helps in visualizing large datasets, revealing data trends, and aiding in quantitative analysis. Avoid using histograms for categorical or nominal data.
Can I customize my histogram?
Yes, histograms can be customized in terms of bin size, color, and labels. Software like Excel, R, and Python offer extensive customization options to make your histograms more informative and visually appealing.
Tailoring these elements can improve the clarity and effectiveness of your data visualization.
What are the common mistakes to avoid with histograms?
Common mistakes include choosing incorrect bin sizes, which can mislead interpretations, and forgetting to label axes.
Overcomplicating the histogram’s design can also detract from its readability. Always ensure that your histogram clearly communicates the intended data analysis and insights.
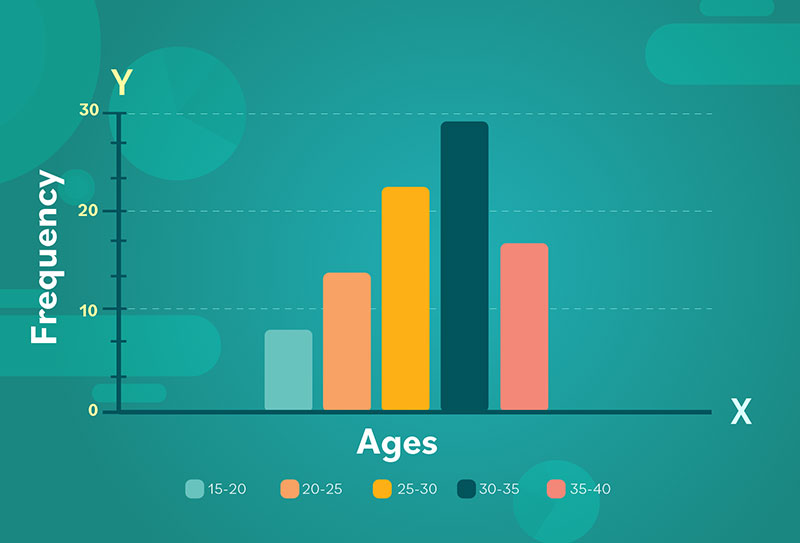
How do histograms differ from bar charts?
While both use bars to represent data, histograms display continuous data with adjacent bars, showing frequency distribution.
Bar charts, on the other hand, are used for categorical data with separated bars. Understanding this distinction ensures proper application and accurate interpretation.
Are histograms applicable in different fields?
Absolutely. Histograms are versatile tools used in various fields such as finance, healthcare, and education. They help in tracking trends, analyzing populations, and understanding probability distributions.
Whether in business analytics or academic research, histograms provide valuable insights into large datasets.
Conclusion
When it comes to understanding data, histogram examples are invaluable. They provide clear, graphical representations of frequency distributions, making data analysis more intuitive. By now, you’ve gained practical insights on creating, interpreting, and customizing histograms using tools like wpDataTables, Excel, R, and Python.
Remember:
- Distribution Patterns: Recognize normal distribution, skewness, and outliers
- Customization: Modify bins, labels, and colors for better readability
- Components: Familiarize yourself with axes, bars, and intervals
Utilizing these tactics ensures your data visualization is clear and effective. Avoid pitfalls like incorrect bin sizes and unlabeled axes to maintain accuracy. Armed with these strategies, you can apply histograms across various fields, enhancing your quantitative analysis and extracting deeper insights from your data.


