Creating a heatmap table is your gateway to unlocking powerful insights from complex datasets. Imagine transforming raw data into visually compelling maps that highlight patterns, trends, and outliers at a glance. Whether you’re diving into a Google Sheets project or fine-tuning data visualization in Excel, mastering this technique is essential.
Heatmap tables aren’t just a fancy tool for data scientists—they’re a critical asset in your business intelligence arsenal, from marketing analytics to web analytics in Google Analytics, guiding smart business decisions. By the end of this article, you’ll not only understand the nuances of creating these tables, but you’ll also harness the power of color gradients to reveal data patterns and trends like never before.
We’ll explore key concepts, walk through practical steps, and delve into advanced tips using tools like wpDataTables to perfect your visual data representation. Prepare to elevate your data analysis game to an art form.
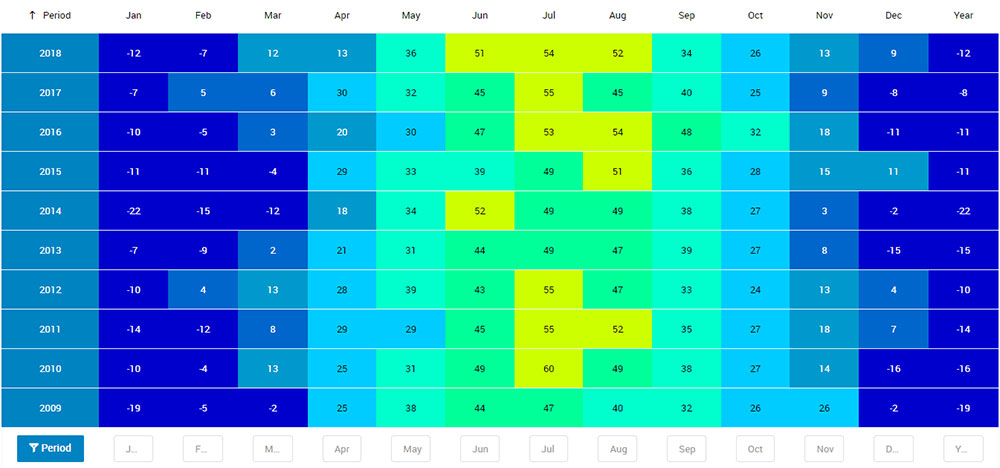
What kind of heatmap table can we create? Well, something like this example below:
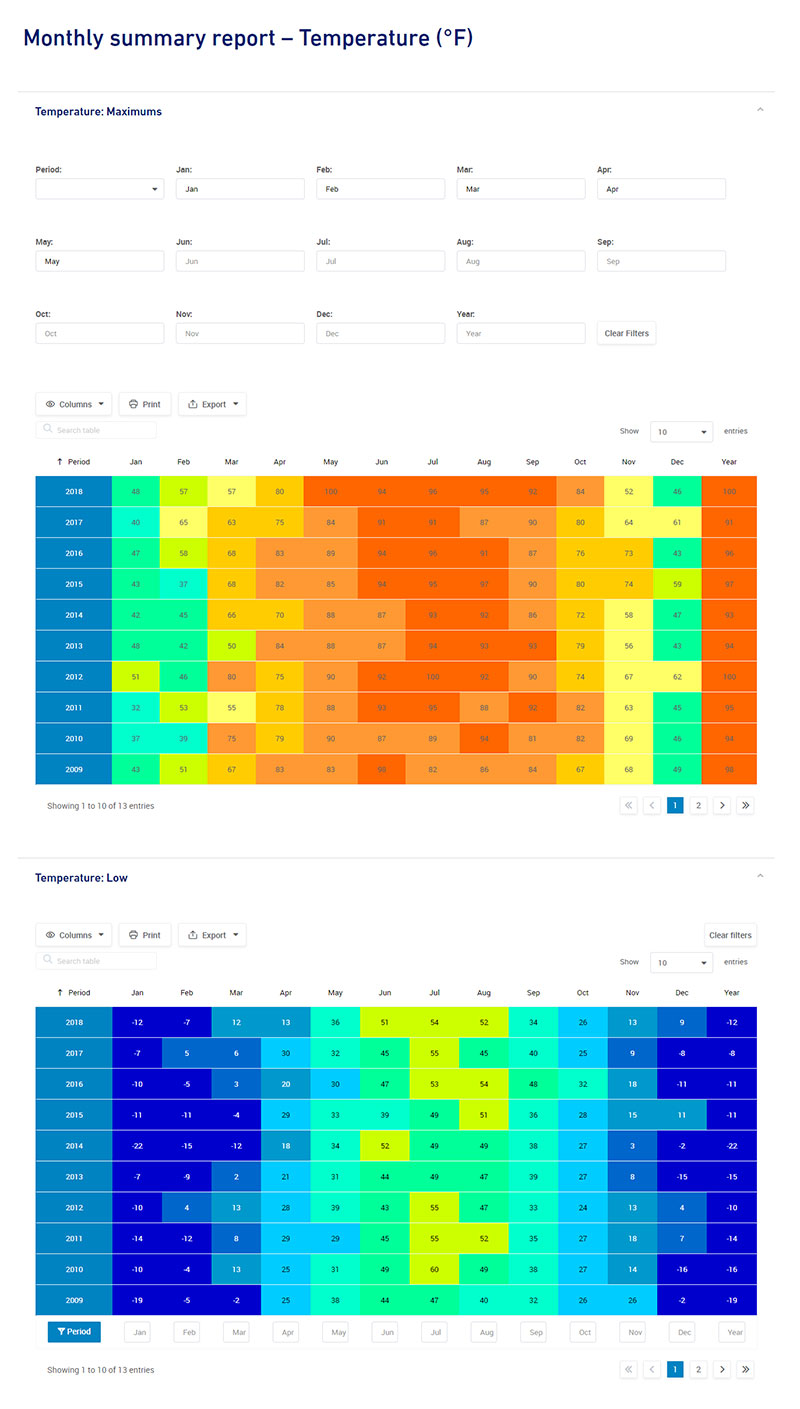
Yes, that is a really long screenshot. You can view the dynamic heatmap table here.
For creating a heatmap table for you or your visitors to compare data values easier, you have few options depending on your source data.
But before heading to the tutorial, I wanted to let you know that there are two sections of this article that you can jump to directly:
Table of Contents
How to create a heatmap table with wpDataTables
1. Creating a table from zero
If you do not have a data source you can create your heatmap table from scratch with the option “Creating tables manually” where you will insert data values manually.
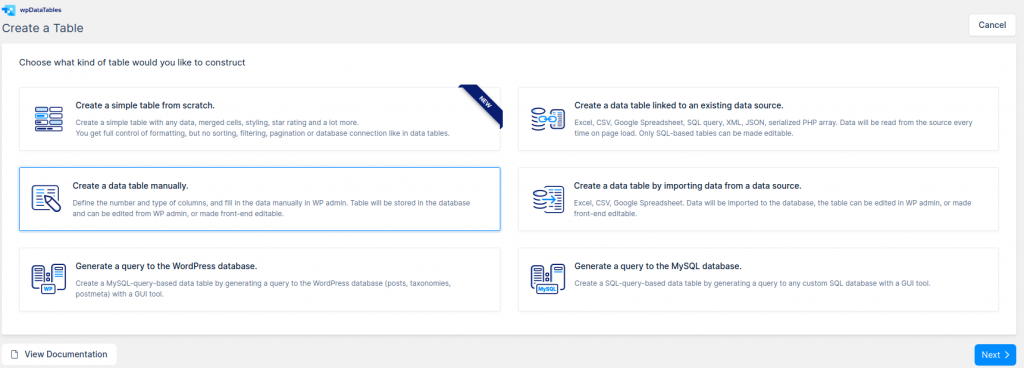
To start creating a data table manually, open your WordPress admin panel, go to wpDataTables -> Create a Table, choose the third option “Create a table manually”, and click “Next“.

You will be shown the wizard step that will assist you to create the table structure where you will create 14 columns: Period, Year, and all other will be names of the months (Jan, Feb…). For Period columns you will leave column type as “One-line string” and for all others, you will set “Integer” column type.
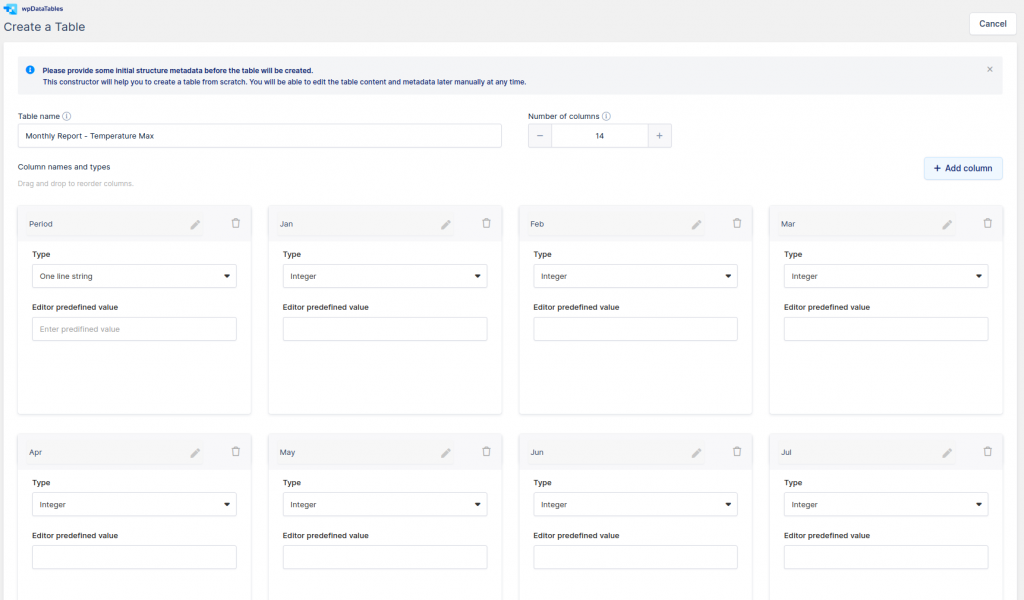
When you have finished configuring the table, click “Create the table”. A dropdown will open with options to “Open in standard editor” or “Open in Excel-like editor” and that’s it. The table structure is created. Now you will insert your numeric data values over the Standard editor or an Excel-like editor.
2. Creating a table heat map from a data source
If you have data in some data source like Excel, CSV, JSON, Google spreadsheet, XML, PHP Serialized array, or in a table in a database (SQL source), you will use the second option in the table wizard.
To start creating a data table linked to an existing data source, open your WordPress admin panel, go to wpDataTables -> Create a Table, choose the second option “Create a data table linked to an existing data source.”, and click “Next“.
Depends on which source you have you will follow instructions:
- How to create a MySQL based table with wpDataTables
- Creating Tables in WordPress from Google Spreadsheets
- Creating Tables in WordPress from Excel
- How to create a table from CSV data
- Creating tables in WordPress from JSON input
- How to create tables in WordPress with XML input
- Creating Tables in WordPress based on serialized PHP arrays
For this table, we use CSV as a data source that you can download from here. You will choose CSV as “Input data source type” and then over the Browse button find that the source that you previously download and upload on your server. Click Save Changes, so wpDataTables will read the CSV file you uploaded and the table will be created.
After creating the table, with any of the two options, you can customize and configure your WordPress table like you need.
In our case, we first turn on the option “Show filters in a form above the table” on the “Sorting and Filtering” tab in table settings and then configure Advanced filters for each column. For the Period column, we set ‘Select Box filter’ and ‘Number filter’ for all other columns.
Then we turn on the option “Responsiveness” on the “Display” tab in table settings and hide values like the “Month” columns for tablets and mobile devices in each Column settings or quicker in the Column list button above the table.

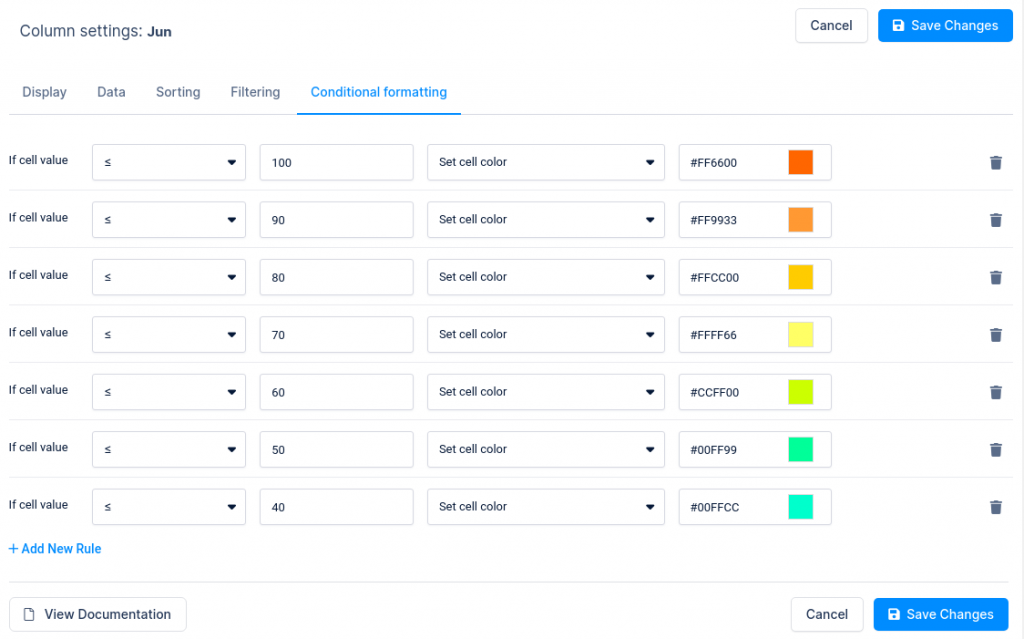
For customizing the table data color palette in an easy and intuitive way, we’re using Conditional formatting. For the first column, we set the condition that if the cell contains 2 then “Set cell CSS class” to “blue-white text” so that we’ll have a white font color over the blue background.
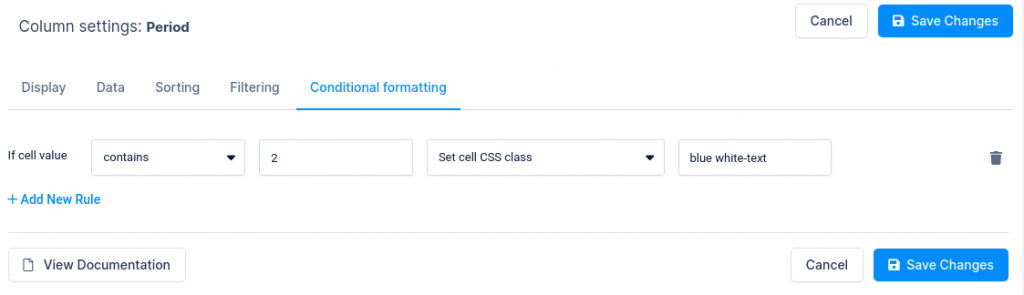
Then we create those classes on the “Custom CSS” field on the “Customize” tab in table settings like this:
.wpdt-c .wpDataTablesWrapper .wpDataTable-1 td.blue{ background-color: #0083c2 !important;}

.wpdt-c .wpDataTablesWrapper .wpDataTable-1 td.white-text{ color: #FFFFFF !important;}
Like this:
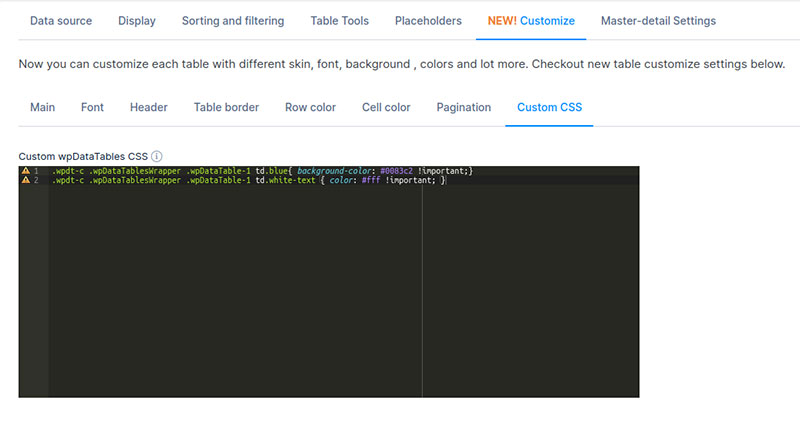
Where number 1 in .wpDataTable-1 is the ID of your table so you will need to change it for your table
For all other columns, we set the same conditions to set different colors based on the value in the table for Max Temperature table.
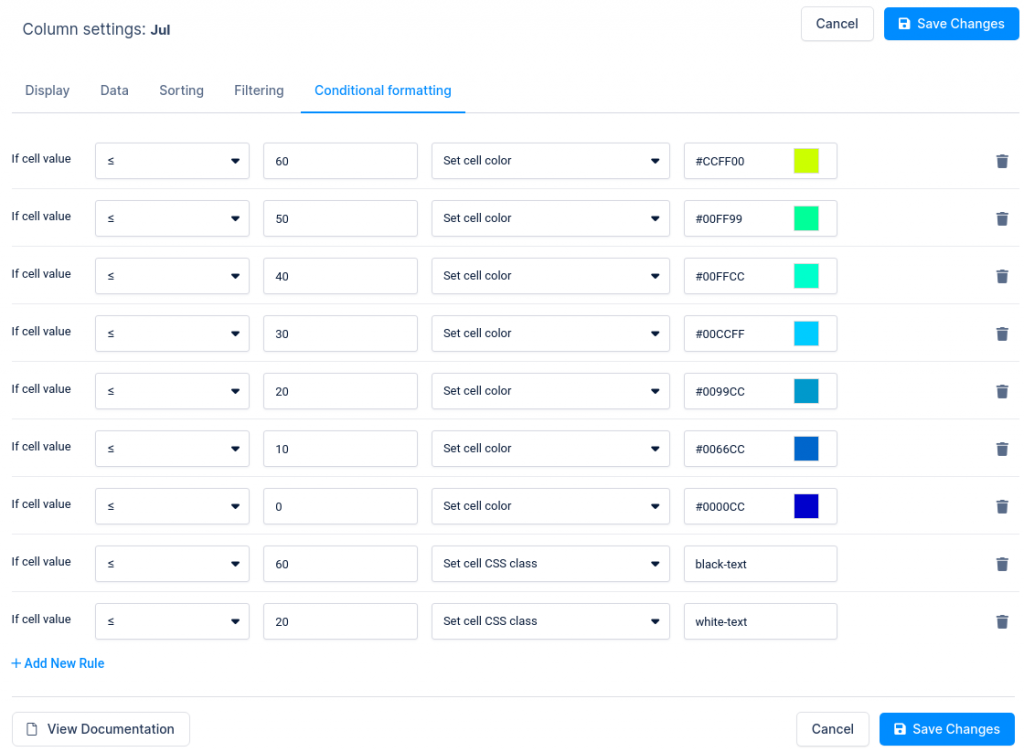
For the second table “Low Temperature” we use the same approach as for the table “Temperature Maximus”, except the conditions in Conditional formatting. Because it is a lower temperature value, we use these conditions.
Then we create those classes on the “Custom CSS” field on the “Customize” tab in table settings like this:
.wpdt-c .wpDataTablesWrapper .wpDataTable-2 td.white-text{ color: #FFFFFF !important;}

.wpdt-c .wpDataTablesWrapper .wpDataTable-2 td.black-text{ color: #000000 !important;}
Where number 2 in .wpDataTable2 is the ID of your table so you will need to change it for your table.
That’s it!
You now have a table heatmap where you can compare data values easily without looking like you are reading the fine print of a contract.
If that was an easy and intuitive way to create heatmaps in a table, check out the next part.
Now what you need to do is to show up on your pages in the front-end. As with any other plugin we use shortcodes for showing tables on users’ pages or posts. Adding shortcodes is very easy, especially if you are using popular page builders like Elementor, WP Bakery, or Gutenberg.
Table heatmap examples
Employee Engagement App
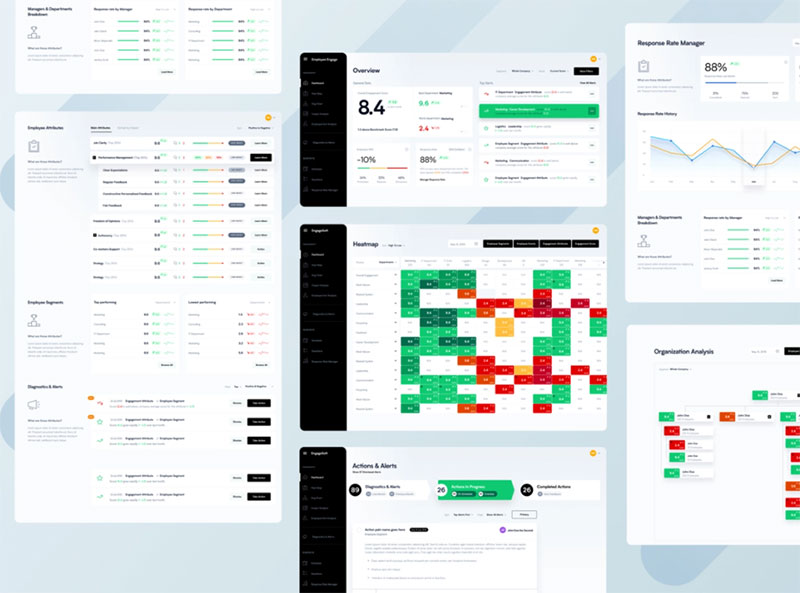
Heatmap
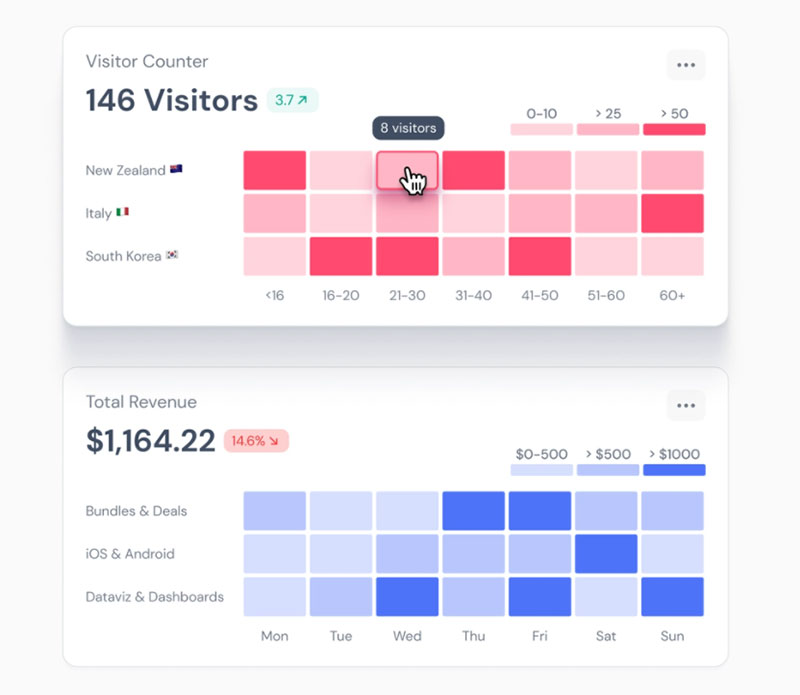
Learning platform

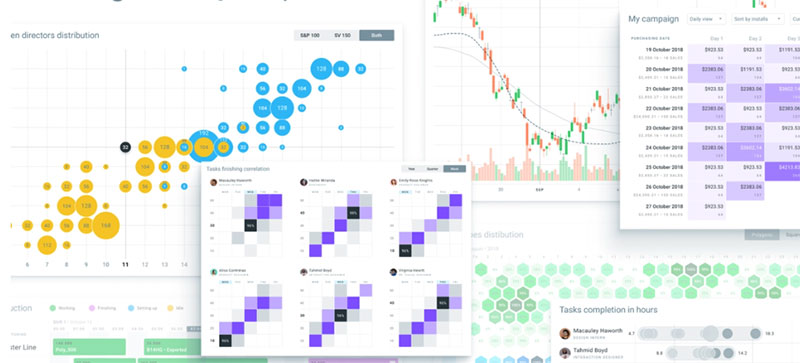
Charts Design Inspiration. Dataviz encyclopedia
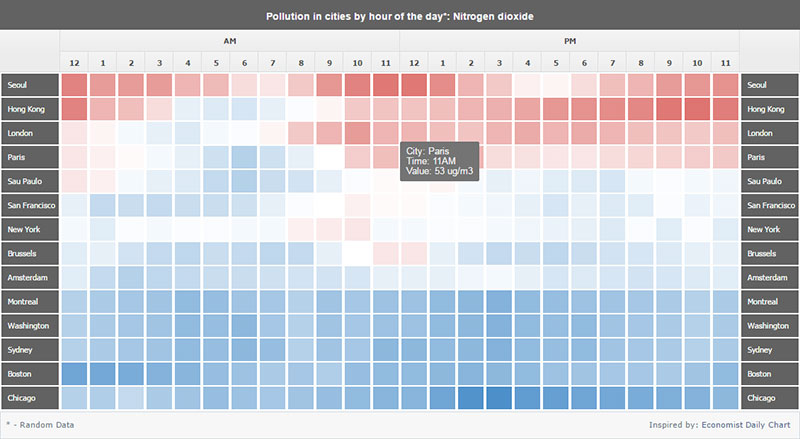
Air Pollution HeatMap
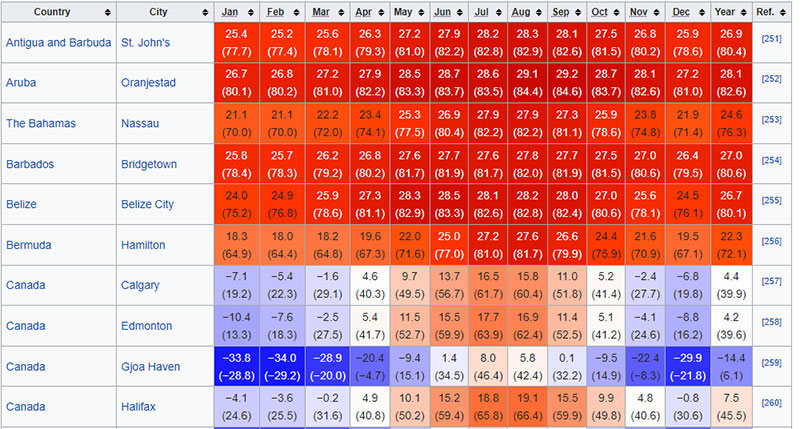
Average temperatures for selected cities in North America
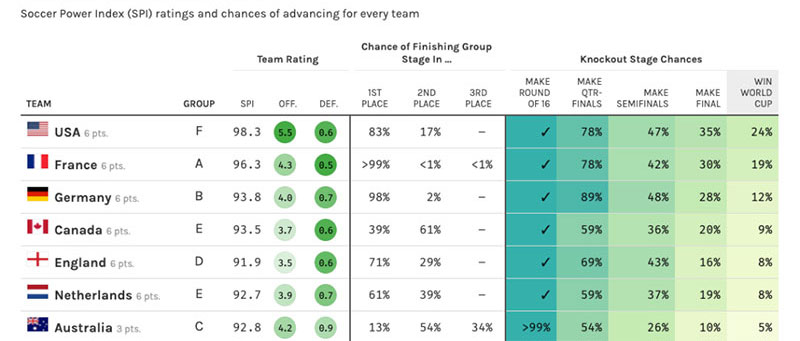
2019 Women’s World Cup Predictions
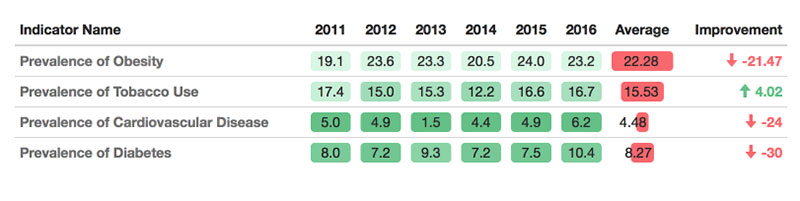
Prevalence table
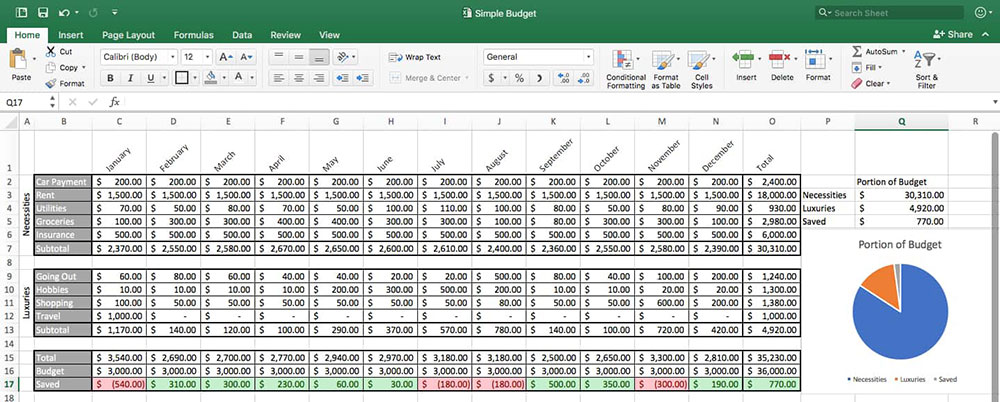
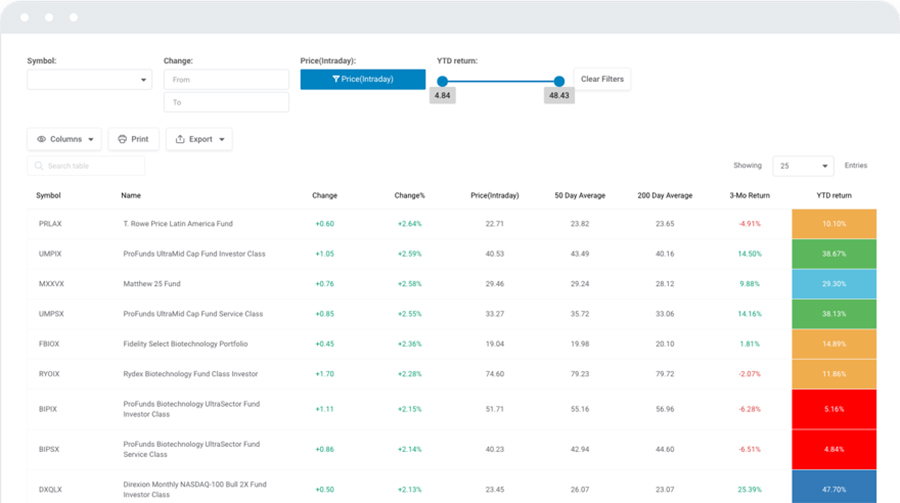
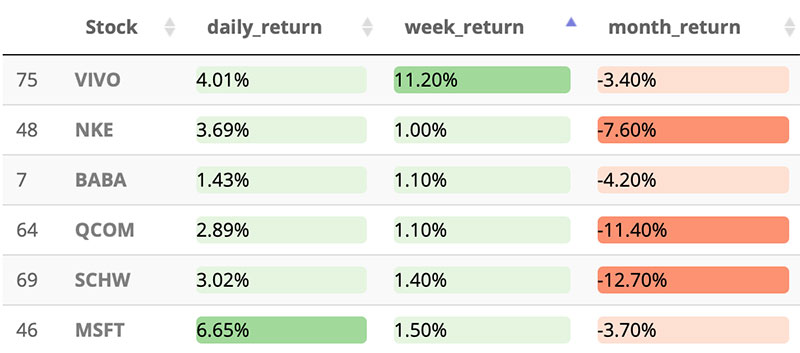
Stock returns
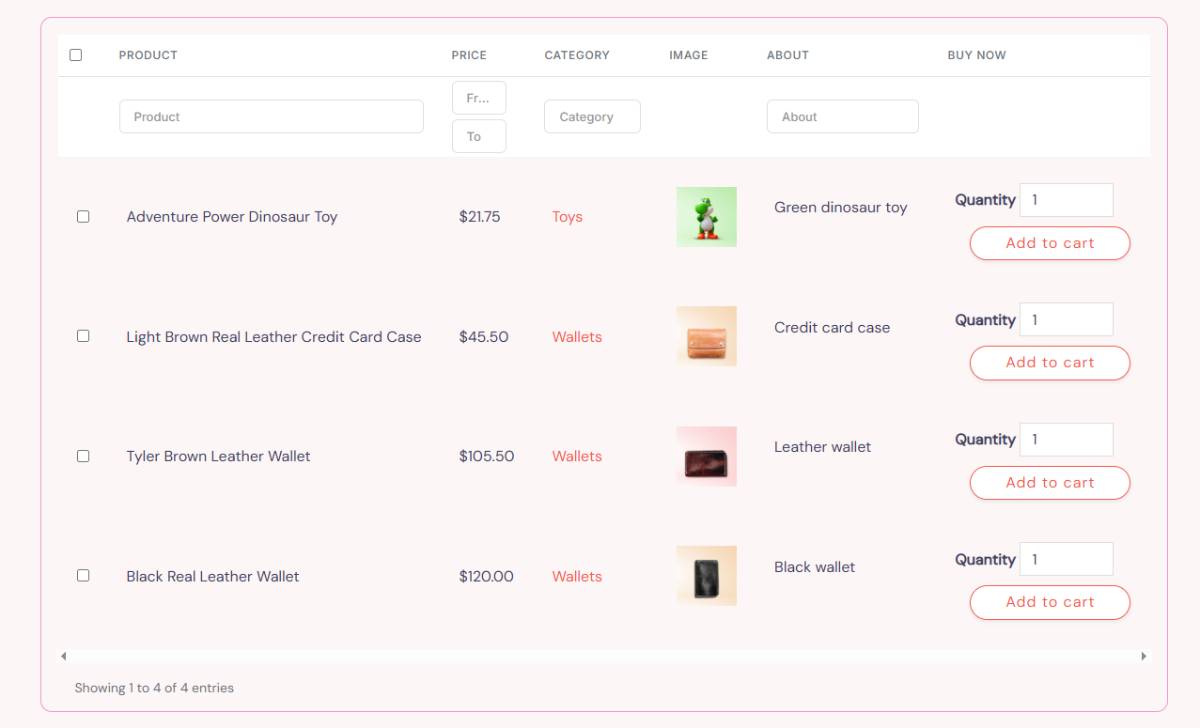
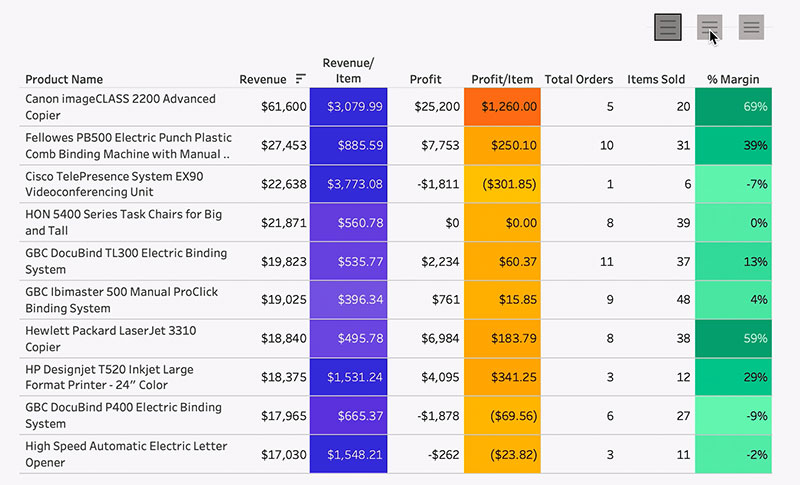
Product revenue stats
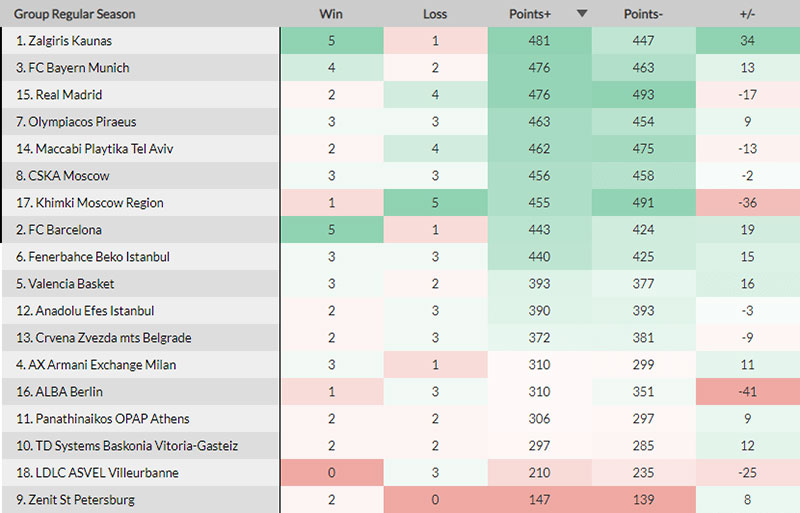
Teams table
FAQ on Heatmap Tables
What is a heatmap table?
A heatmap table is a graphical representation of data where values are depicted by color. This data visualization technique helps to quickly identify trends and patterns within a data matrix. By using color gradients, complex data becomes easier to understand, helping in tasks from marketing analytics to business intelligence.
Why should I use a heatmap table?
Using a heatmap table simplifies data analysis by translating numerical data into a visual format. It reveals data patterns and outliers at a glance, aiding in decision-making processes. This is particularly useful in fields like web analytics and user experience design, where quick insights are crucial.
How do I create a heatmap in Excel?
To create a heatmap in Excel, first input your data matrix. Then, navigate to “Conditional Formatting” in the toolbar, select “Color Scales,” and choose a color gradient. This applies a color-coded scheme to your data, making trends visible instantly, enhancing your data visualization techniques.
Can I make a heatmap table in Google Sheets?
Yes, Google Sheets allows for easy heatmap creation. Input your data, then utilize the “Conditional Formatting” feature. Choose a color scale to apply visual gradients to your data cells, turning raw numbers into a color-coded heatmap that showcases data trends and visual analytics effectively.
What tools can I use other than Excel and Google Sheets?
Beyond Excel and Google Sheets, tools like Tableau, Power BI, Heatmap.js (a JavaScript library), and Python (using Matplotlib or Seaborn libraries) are excellent for creating interactive heatmaps. Moreover, leveraging Python Screenshot APIs can streamline the process of capturing and integrating visual elements into your heatmap analysis, providing a comprehensive view of your data. These tools offer advanced data visualization and customization options for more sophisticated heatmap designs.
What are the best practices for designing a heatmap table?
When designing a heatmap table, focus on meaningful color gradients, clear legends, and well-organized data. Make data points easily distinguishable. Use a logical layout to emphasize key trends. Avoid overly complex color schemes to ensure your visual data representation is intuitive and effective.
How do I use color gradients effectively in a heatmap?
To use color gradients effectively, choose contrasting colors to represent different data ranges. Ensure the scale is intuitive—darker shades for higher values and lighter shades for lower values. This enhances the visual interpretation of data patterns, making your heatmap analysis straightforward and accessible.
How can heatmaps be used in marketing analytics?
In marketing analytics, heatmaps can highlight consumer behavior trends, track user interactions on websites, and identify high-performing areas. By visualizing these data points, data scientists can optimize marketing strategies, improve user engagement, and derive actionable insights from web analytics and ecommerce data.
What are the common mistakes to avoid when creating a heatmap?
Avoid overwhelming your heatmap with too many color variations, which can confuse users. Ensure the data is relevant and scales are clear. Misinterpreting color gradients or applying them inconsistently can lead to incorrect insights, compromising the integrity of your data analysis and subsequent decisions.
Can I make an interactive heatmap?
Absolutely. Tools like Tableau, Power BI, and Heatmap.js offer robust features for interactive heatmaps. Use these platforms to incorporate zoom, filter, and hover-over effects. This interactivity makes data exploration dynamic and engaging, enabling deeper data interpretations and more actionable insights.
Conclusion
Mastering how to create a heatmap table transforms raw datasets into visually compelling insights.
With color gradients and interactive features, heatmaps simplify data visualization. From tracking trends in marketing analytics to optimizing user experience, the applications are vast.
Key Takeaways:
- Understand heatmap creation fundamentals.
- Employ best practices in design.
- Harness tools like Tableau for advanced interactive heatmap capabilities.
By following these steps, you’ll transform data into actionable insights, driving impactful decisions and visual storytelling. Dive into creating a heatmap table, and unlock the full potential of your data visualization skills.
If you liked this article about heatmap tables, you should check out this article about the best fonts for tables.
There are also similar articles discussing how to make a table responsive, WooCommerce product tables, how to merge cells in HTML, and WordPress pricing table plugins.
And let’s not forget about articles on how to design a table, JavaScript data table, table UI design, and examples of data tables.