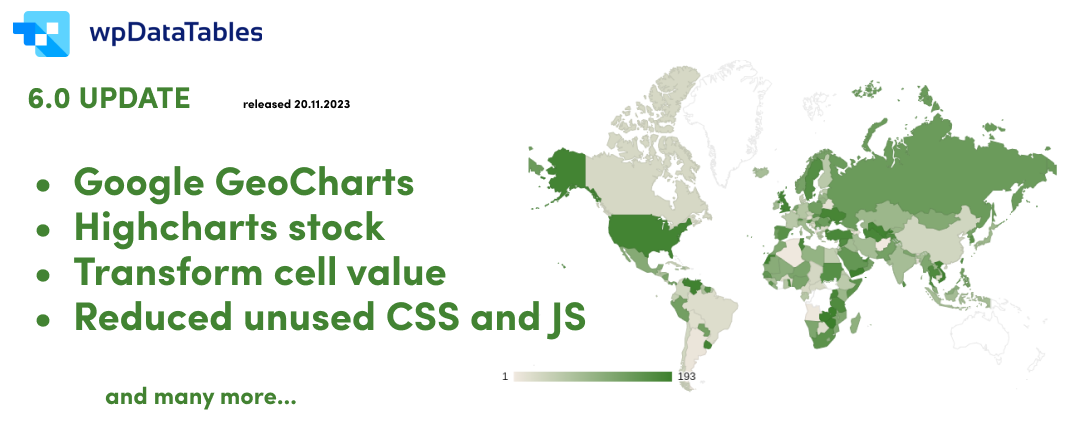
As the year draws to a close, we’re eager to sprinkle a bit of early holiday magic your way. The gift? An eagerly awaited update – wpDataTables 6.0. So, grab your coffee, ease back into your workspace, and let’s dive into what’s new! Unwrap the present with us and discover a world of enhancements, innovations, and everything you’ve been waiting for in this game-changing release. ‘Tis the season for data transformation, and we’re bringing the celebration to you!
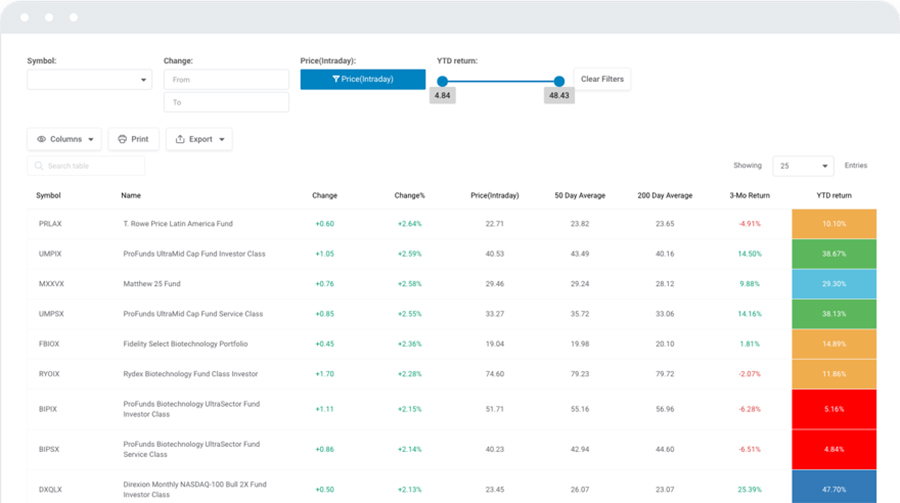
Higcharts Stock
Meet Highcharts Stock – your data’s new best friend. Imagine a sidekick that turns boring numbers into interactive stories. That’s Highcharts Stock for you! It’s like a wizard for traders and analysts, making financial data less of a puzzle and more of a breeze. From zooming into timelines to super-smooth technical analysis, this extension takes your charts to a whole new level. So, kick back, relax, and let Highcharts Stock sprinkle a bit of magic on your market insights – because who said data can’t be fun? If you would like more examples, please visit our documentation page and find the one that best suits your needs.
Google GeoCharts
We are thrilled to introduce three exciting new Google GeoCharts features that will revolutionize how you interact with your data. With wpDataTables 6.0, say hello to the Region GeoChart, Marker GeoChart, and Text GeoChart! If you’re unfamiliar with them, we hope the examples below will help you. GeoCharts uses a Google Maps API key. For a complete tutorial on how to set it up, please visit our documentation page and follow our step-by-step instructions.
Region GeoChart:
The Region GeoChart is a powerful addition to wpDataTables, allowing you to create interactive maps that display data based on geographical regions. Whether you want to visualize sales by country, analyze population distribution, or track the spread of your product across different states, the Region GeoChart has you covered. Now you can see your data come to life on a map, making it easier to identify trends and make informed decisions.
Marker GeoChart:
Need to pinpoint specific locations on a map? The Marker GeoChart has got you covered. This feature enables you to place markers on a map to represent individual data points, making it ideal for displaying data related to locations, events, or customer distribution. Whether you’re mapping store locations or tracking the journey of your sales team, the Marker GeoChart simplifies data visualization.
Text GeoChart
Sometimes, simplicity is key. The Text GeoChart provides an elegant solution for displaying location-based information without the need for complex graphics. This feature allows you to label specific regions or locations with text, making it perfect for creating data-rich, informative maps without visual clutter. If you need to convey information quickly and clearly, the Text GeoChart is your go-to tool.
Transform cell values
Unleash the power of data customization with the new Transform Cell Values feature, available from wpDataTables 6.0. This game-changing tool allows you to consolidate values from multiple columns into a single cell effortlessly. Moreover, it lets you seamlessly concatenate any column’s value, turning it into valid HTML for a dynamically computed display. Whether you’re streamlining information or enhancing visual appeal, Transform Cell Values puts the control in your hands for a more tailored and impactful data representation. If you’re not sure what this does, just head to our documentation page where you’ll find a detailed explanation and more examples to help you out.
In the table below, observe Columns TV1 and TV2. For TV1, we merged data from three columns—First Name, Last Name, and Email—into a single column. In the second column, TV2, we transformed data from Email and First Name, creating a hyperlink for an enriched presentation.
Select/Deselect all
You asked, and we listened! We bring you a time-saving upgrade: ‘select/deselect all‘ buttons on query constructor columns and a handy checkbox on the Column List. With wpDataTables 6.0, your workflow just got faster—because you requested it, and now you have it. Let’s dive in and see how these additions will speed up your work.
Button on query constructor columns

Checkbox on Column List
")
Improvements
In addition to these exciting new features, we’re thrilled to share some impactful updates. Our latest optimizations include a significant reduction in unused CSS and JS, boosting SEO efficiency for your website. Responding to your requests for WCAG compliance, we’ve introduced an option for partial Frontend WCAG compliance, with full compliance on the horizon.
Thank you for embarking on this journey with us. Your unwavering support and invaluable feedback have propelled us to where we are today. As we strive to meet your needs and aspirations, your positive reception of these new features has been truly inspiring. Yet, the best is yet to come. Anticipate more innovation and enhancements in future updates. If you have specific features in mind or crave further improvements, visit our ‘Suggest a Feature’ page. Share your thoughts or give a thumbs up to existing requests; you might be surprised how many share your vision. Until our next update, enjoy the newfound capabilities in wpDataTables 6.0, and we look forward to bringing you even more exciting developments. See you soon!