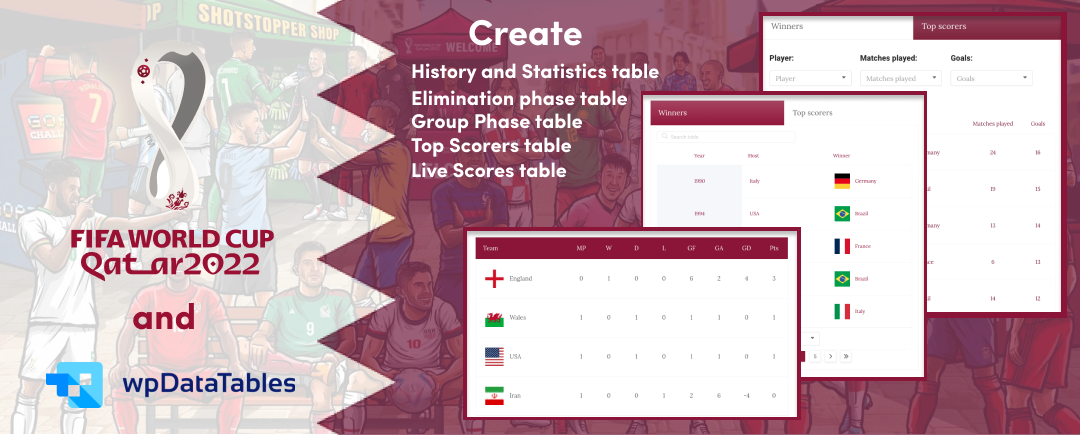
The 2022 FIFA World Cup is an international and very popular event in the world and this year is taking place in Qatar from November 20 through December 18, 2022. Almost every website having any relation to sports, news, and more will try to get a larger audience by using information from the World Cup such as scores, statistics, etc.
With wpDataTables you are able to show and track different kinds of information related to the World Cup (Live scores, Groups, Elimination phase, History and Qualifiers as well). All these examples of World Cup tables are really easy to make, and we wanted to show you the various options you can use.
Table of Contents
Live score tables
In the Live score tables below, you are able to track results live from the 2022 FIFA World Cup day by day. Scores from every match will be shown by day, as well as more details about the match.
There are several options to create those tables. In the first example, Live API data, we used this free API which has a lot of useful information about the World Cup of 2022. You can create tables using Nested JSON for JSON APIs, and all the data will be automatically updated. This API does not contain flags, so we’ve made them using Conditional formatting by replacing content with our images. The API has a deeper structure, so we also need to use a hook for getting data. Here is the hook:
[php]
/**
* Parse one level deep in nested JSON structure
* @param $deep
* @param $url
* @param $tableID
* @return bool|mixed
*/
function filterWCAPI($deep, $url, $tableID){
// for specific url
if ($url == ‘https://worldcupjson.net/matches/today’){
$deep = true;
}
return $deep;
}
add_filter(
‘wpdatatables_get_one_level_deep_json_data_from_array_as_string’,
‘filterWCAPI’,
10, 3);
[/php]
For the Match details button, we used our Master-detail add-on.
In the second example, Live DB data, we created a manual table with seven columns (Team 1, Flag 1, Team 2, Flag 2, Score 1, Score 2, and Date). Then, this table from the database was used to create a new table using an SQL query. We used CONCAT to merge the Flag and Team columns, and the %CURRENT_DATE% placeholder to filter only the matches being played on the present day.
Colors and other custom CSS can be changed in the Customize settings tab for each table.
Group phase tables
In the group phase, you will see tables showcasing the World Cup groups in the tournament, alongside their statistics.
There are a lot of different options for creating these World Cup tables. In this example, we’ve created a manual table by importing a CSV file with seven columns (Team, Flag, Match played, Win, Deal, Lose, Goals for and Goals against). Then, this table from the database was used to create a new table with an SQL query. We used CONCAT to merge Flag and Team columns. Finally, we’ve created two formula columns that calculate Goal difference and Points.
Colors and other custom CSS can be changed in the Customize settings tab for each table.
Elimination phase tables
In the elimination phase, you can see two different views of the schedule after the group phase – a vertical and a horizontal view.
| Round of 16 | |||||||||||
| Saturday 3 Dec | Sunday 4 Dec | Monday 5 Dec | Tuesday 6 Dec | ||||||||
|
|
|
|
|
||||||||
|
|
|
|
|
||||||||
| Quarter - Finals | |||||||||||
| Friday 9 Dec | |||||||||||
|
|
|||||||||||
|
|
|||||||||||
| Saturday 10 Dec | |||||||||||
|
|
|||||||||||
|
|
|||||||||||
| Semi - Finals | |||||||||||
| Tuesday 13 Dec | |||||||||||
|
|
|||||||||||
| Wednesday 14 Dec | |||||||||||
|
|
|||||||||||
| 3rd Place | |||||||||||
| Saturday 17 Dec | |||||||||||
|
|
|||||||||||
| F i n a l | |||||||||||
| Sunday 18 Dec | |||||||||||
|
|
|||||||||||
| Round of 16 | Quarter - Finals | Semi - Finals | 3rd Place | F i n a l | |||||||||||
| Saturday 3 Dec | |||||||||||||||
|
|
Friday 9 Dec | ||||||||||||||
|
|
|
||||||||||||||
| Tuesday 13 Dec | |||||||||||||||
| Sunday 4 Dec |
|
|
|||||||||||||
|
|
|||||||||||||||
|
|
Saturday 17 Dec | Sunday 18 Dec | |||||||||||||
|
|
|
||||||||||||||
| Monday 5 Dec | |||||||||||||||
|
|
Saturday 10 Dec | Wednesday 14 Dec | |||||||||||||
|
|
|
|
|||||||||||||
| Tuesday 6 Dec |
|
||||||||||||||
|
|
|||||||||||||||
|
|
|||||||||||||||
For creating these World Cup tables, we’ve used the Simple table option in wpDataTables. Utilizing a few easy modifications (remove borders, merge cells, change font, background, styles, etc.), you can make these two tables or even better ones for your own needs.
History and statistics tables
The history section shows table statistics from previous World Cup tournaments. You can view all of the winners and top scorers.
There are several options to create these tables. We used Nested JSON and API for this table, but we didn’t receive all the information we needed. So, we exported this table to an Excel file, created a new manual table, imported the Excel file, and added the missing columns that we wanted to show.
Colors and other custom CSS can be changed in the Customize settings tab for each table.
Qualification tables
In the qualifications, you’ll find a World Cup qualifiers table for each group, complete with statistics and qualified teams.
Europe qualifiers tables
Qualifiers tables for the rest of the world
There are several options to create these tables. In this example, we created an Excel file with all the data that we want to show. Then, we imported that file and created a manual table. This table from the database was used to create a new table with an SQL query. We used CONCAT to merge the flag and Team columns. Then, we created two formula columns to calculate Goal difference and Points.
Colors and other custom CSS can be changed in the Customize settings tab for each table.
Other examples include creating a manual table without importing a file, such as directly in wpDataTables, or creating a table with Nested JSON, where all the data changes automatically.
If you want to use the Nested JSON option, be aware that most API-s for the World Cup require payment.
And that’s it! Now you are able to create it on your own website as well. Isn’t that awesome?
If you find these examples useful, we can suggest that you check out our other examples from our showcases, where you can find a lot of practical and organized tables like:


