wpDataTables and WP Umbrella Integration for Smart WordPress Management
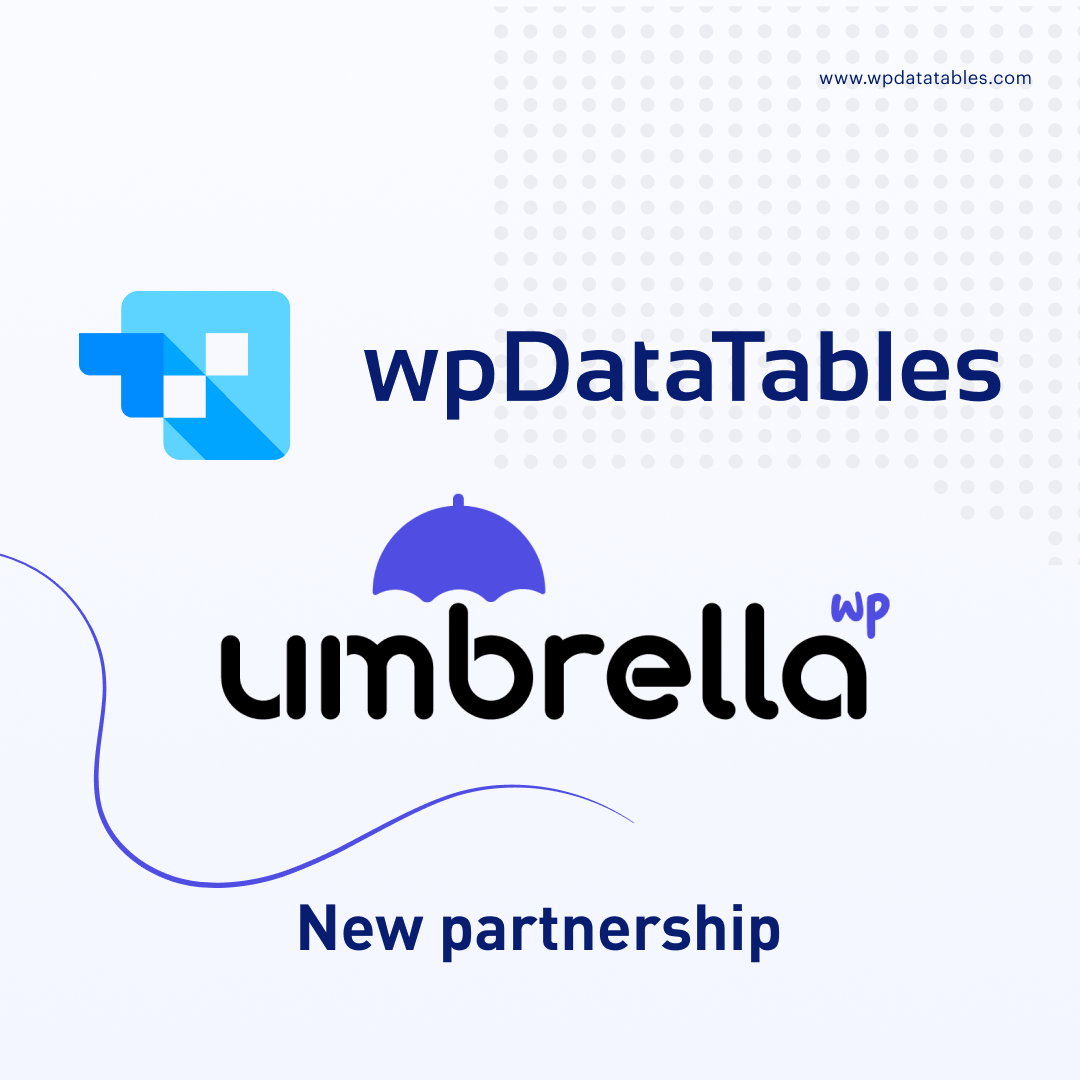
wpDataTables is now officially integrated with WP Umbrella – a combination that brings even more functionality and efficiency to your WordPress workflow! This integration will help you build better-performing, more secure, and easier-to-maintain websites. What Does This Mean for You?…