Every library in this category lists sorting, filtering, and pagination on its homepage. That’s the baseline, not a differentiator, which is why comparing spec sheets gets you nowhere.
What actually separates JavaScript table libraries is how they behave once the dataset gets big, which framework they lock you into, and what a per-developer seat costs when your team grows.
AG Grid, TanStack Table, DataTables, Handsontable, Tabulator, and the rest all sit in different places on those three axes.
Table of Contents
JavaScript Table Libraries
Ten options across free engines, freemium grids, and commercial suites, with the best all-around pick first.
How we tested: we built the same 50,000-row dataset in every library during July 2026, wired to the same JSON source, and pushed each one to 500,000 rows to see where it broke. Free and MIT-licensed libraries were tested in full. For the commercial tiers we didn’t license, AG Grid Enterprise, Handsontable’s commercial build, DHTMLX PRO, and MUI X Pro and Premium, we tested the free or trial edition and have said so rather than guessing at the gated features.
| Need | Best Pick | Model |
|---|---|---|
| Enterprise + huge datasets | AG Grid | Freemium |
| Full control over rendering | TanStack Table | Free |
| jQuery and static HTML | DataTables | Free |
| Excel-like cell editing | Handsontable | Commercial |
| Free and full-featured | Tabulator | Free |
| Lightweight and simple | Grid.js | Free |
| React on Material UI | MUI X Data Grid | Freemium |
| Enterprise analytics | DHTMLX Grid | GPL / Commercial |
| Massive data, canvas speed | Glide Data Grid | Free |
| Complex multi-region layouts | Bryntum Grid | Commercial |
AG Grid – Best for enterprise apps with massive datasets
AG Grid streams millions of rows without freezing the browser. The server-side row model is the reason, and it works across React, Angular, Vue, and vanilla JavaScript.
Best for enterprise teams pushing huge datasets through dashboards and admin panels, especially when huge tabular datasets are the whole job.
What you get:
- Virtual scrolling and a server-side row model
- Row grouping and aggregation
- Integrated charts and pivoting
- Excel export
Pricing: Community edition free (MIT). Enterprise is $999 per developer. Licensing is per developer seat, not per application, so a five-person front-end team needs five licenses. AG Grid has historically sold this as a perpetual license bundled with one year of support and updates, though some current reporting describes an annual subscription instead. Confirm the model on ag-grid.com before budgeting.
Where it wins:
- Handles millions of rows
- Deep feature set
- Strong docs
Where it falls short:
- Per-seat cost adds up fast
- Steeper learning curve than lighter grids
What we found testing it: on the MIT Community build, virtual scrolling held steady past 100,000 rows where client-side grids started dropping frames. Setup took noticeably longer than Grid.js or Tabulator, and the API is broad enough that the docs stay open beside you for the first day. The server-side row model, integrated charts, pivoting, and aggregation all sit in Enterprise, which we didn’t license, so we can’t speak to those from use. What we can say is that Community covered our test case entirely, which matches the pattern of teams buying Enterprise for two or three specific features.
Community already covers most needs, though. Teams often buy Enterprise for two or three features they could have hand-rolled.
TanStack Table – Best for custom-designed UIs (headless)
TanStack Table gives you the table logic and none of the markup. Sorting, filtering, grouping, pagination, all as state and math you render yourself.
Best for product teams keeping a custom design language across React, Vue, Solid, Svelte, and Angular. You own every element, class, and style.
What you get:
- Column sorting logic and filtering
- Grouping and pagination
- Row selection
- Framework adapters across five ecosystems
Pricing: Free, MIT license, no paid tier.
Where it wins:
- Total rendering control
- Tiny footprint
- Framework-agnostic
Where it falls short:
- You build the UI yourself, so more upfront dev time
- Accessibility is on you, since the freedom that sells it strips out the guardrails component grids hand you free
TanStack reports 1.1 billion total downloads, roughly 20.5 million weekly across all framework adapters, and about 28,200 GitHub stars.
What we found testing it: the logic worked exactly as advertised, and so did the consequence. Sorting, filtering, and pagination state arrived clean, then we wrote every <table>, <tr>, and class ourselves. Getting to a usable table took longer than any component grid here by a wide margin. The payoff is that the result matched our design system without fighting anyone else’s CSS. Accessibility was entirely on us, no roles, no keyboard handling, nothing free, which is the part that catches teams expecting a grid.
DataTables – Best for jQuery projects and static HTML tables
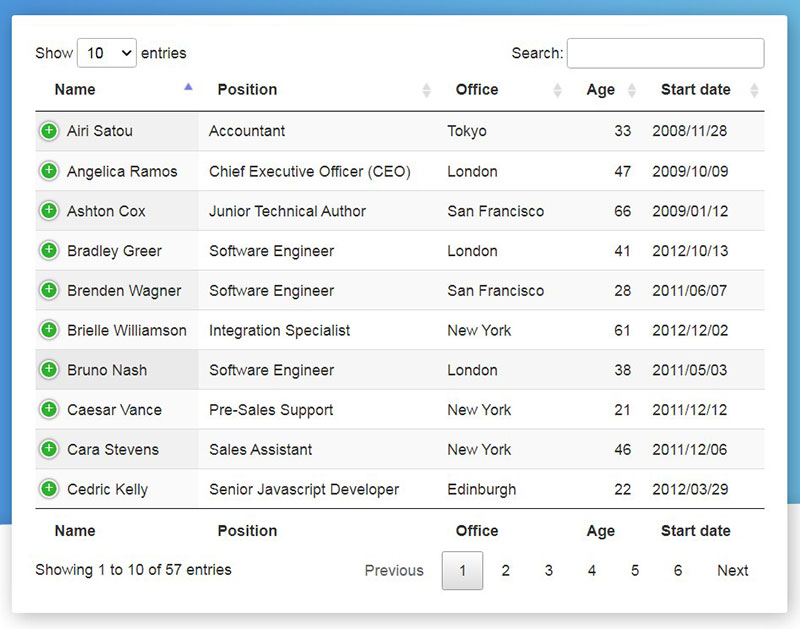
DataTables drops onto an existing HTML table with almost no restructuring. Search, sorting, and pagination arrive without a framework rewrite.
Best for teams maintaining jQuery stacks or enhancing server-rendered tables.
What you get:
- Sorting, filtering, and pagination
- AJAX loading
- CSV export
Pricing: Free (MIT), with paid support licenses available.
Where it wins:
- Huge community and battle-tested code
- Minimal setup on static tables
Where it falls short:
- jQuery dependency
- Feels dated on modern SPA stacks
On a legacy admin page, wiring it onto an existing table took minutes versus a full grid migration. Its npm package still pulls several hundred thousand weekly downloads, so “legacy” overstates how dead it is.
The real cost is the jQuery reliance, not licensing. On a React or Vue build, these jQuery-based table plugins fight the framework.
What we found testing it: dropping it onto an existing server-rendered table took minutes, one init call and the table gained search, sorting, and pagination without touching the markup. Nothing else here is that fast on an existing page. Then we tried the same thing inside a React component and the friction was immediate: jQuery managing DOM that React also thinks it owns is the wrong shape for a modern build. Its npm package still pulls several hundred thousand weekly downloads, so “legacy” overstates how dead it is.
Handsontable – Best for spreadsheet-style editing
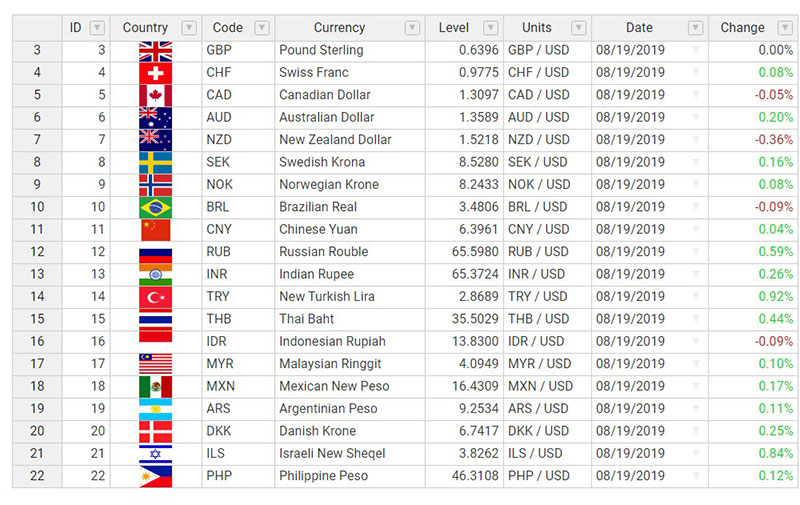
Handsontable is the closest thing to Excel running in a browser. Users edit cells, paste from a spreadsheet, and get formulas and validation the way they expect.
Best for finance and ops teams building internal tools and data-entry screens.
What you get:
- Inline editing with cell validation
- Formulas (400+ functions via HyperFormula)
- Copy-paste from Excel
- Dropdown cells
Pricing: Free for non-commercial use. Commercial licensing is quote-based and not published transparently. Reseller listings put it around $979 per developer, and other reporting cites figures near $999 per developer per year. Request a quote rather than budgeting off a listing price.
Where it wins:
- Closest thing to Excel in a browser
- Strong data-entry UX
Where it falls short:
- Roughly 247 kB bundle is heavy, per Simple Table’s 2026 breakdown (247.1 kB), a real hit for mobile users
- Business use needs a paid license
What we found testing it: we used the free non-commercial build. Pasting a block of cells straight from Excel worked on the first attempt, and the keyboard shortcuts matched spreadsheet muscle memory closely enough that nobody had to learn anything. Formulas through HyperFormula behaved like the real thing. The bundle weight is the honest cost, around 247 kB, which we felt on a throttled mobile connection in a way we didn’t with any other library here.
Watch the trial trap here. Teams build the whole app during the trial, then face paying up or rebuilding.
Tabulator – Best for free, feature-rich vanilla JS tables
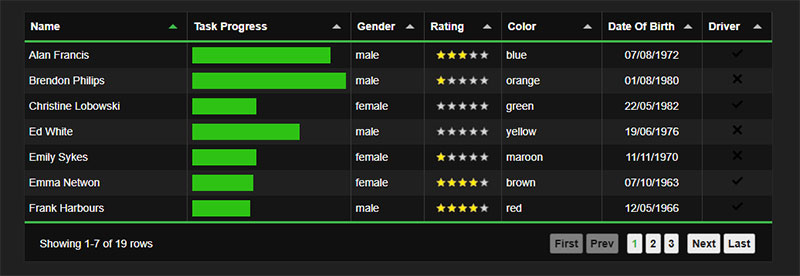
Tabulator delivers enterprise-level features under a permissive open-source license. Tables build from HTML, arrays, JSON, or AJAX, with optional React, Angular, and Vue wrappers.
Best for budget-conscious teams wanting power without commercial fees.
What you get:
- Sorting and editable cells
- Custom formatters and responsive layout
- Data downloads
- Options to filter rows with JavaScript
Pricing: Free (MIT).
Where it wins:
- No cost or usage limits
- Works with or without a framework
- Rich docs
Where it falls short:
- Larger bundle
- Less framework-native than dedicated React or Vue grids
What we found testing it: this was the closest free match to a commercial grid. Editable cells, custom formatters, grouping, and JSON loading all worked without add-ons or a license key, and the config needed was noticeably lighter than the component grids demanded for the same result. If you’re replacing DataTables in an existing project and want feature parity minus jQuery, this was the least painful path we tried. The bundle is heavier than Grid.js, which is the trade.
Its jQuery-era reputation undersells it. It began as a jQuery plugin, but the current build is zero-jQuery vanilla JS.
Grid.js – Best for lightweight, minimalist tables
Grid.js is tiny, TypeScript-written, and framework-agnostic. Search, sorting, and pagination without the weight of a full data grid.
Best for small sites and MVPs needing basic interactivity fast, across React, Angular, Vue, or vanilla JS.
What you get:
- Search and sorting
- Server-side data support
- A plugin system
- Clean table pagination controls
Pricing: Free (MIT).
Where it wins:
- Lightweight with a clean API
- Framework-agnostic
Where it falls short:
- Limited advanced features, not built for millions of rows
- Slower development pace than the bigger grids, so check recent release activity
What we found testing it: shortest path from install to a working sortable table of anything here, a handful of lines and it renders. On a few thousand rows it loaded faster than the heavier grids with no tuning at all. It also runs out of road fastest: past sorting, search, and pagination there isn’t much more, and it was visibly straining well before our 500,000-row test. Server-side data did work, which surprised us given how often that’s assumed to be a paid feature.
It quietly handles server-side data too, a feature people assume requires a paid grid.
MUI X Data Grid – Best for React apps on Material UI
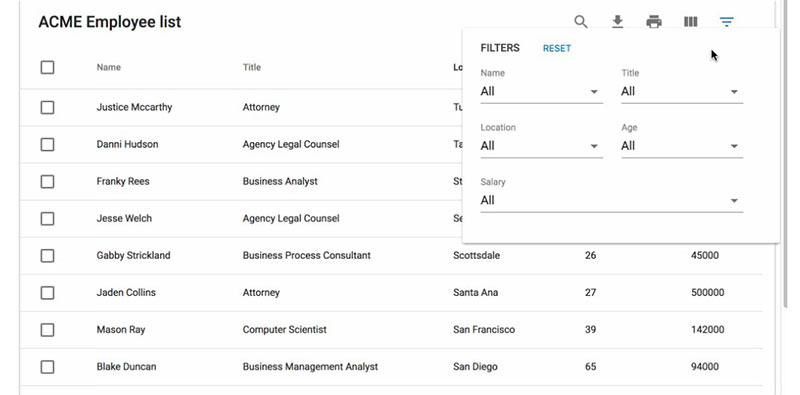
MUI X Data Grid plugs straight into the Material UI ecosystem with frictionless theming. React teams already on MUI get filtering, sorting, and aggregation without building renderers from scratch.
Best for React teams standardized on Material UI.
What you get:
- Filtering, sorting, and aggregation
- Column pinning
- Tree data (Pro)
Pricing: Community free (MIT). Pro is $180 per developer per year ($15 per developer per month billed annually). Premium is $588 per developer per year (Vendr, 2026).
Where it wins:
- Fast path to a clean React table
- Open-core model with solid docs
- Cheapest commercial entry here by a wide margin, with no minimum seat count
Where it falls short:
- React-only
- Advanced features gated behind Pro and Premium
What we found testing it: in a React app already running Material UI, this was the fastest route to a table that looked like it belonged, no theming work, no style overrides. Filtering and sorting came free on Community. Column pinning, tree data, and aggregation prompted for Pro when we reached for them, and we didn’t license it, so those are unverified here. Outside a MUI project the appeal drops away sharply, since you’re pulling in a design system to get a grid.
The free Community tier is more capable than most assume. Plenty of teams pay for Pro over one or two gated features.
DHTMLX Grid – Best for enterprise analytics dashboards
DHTMLX Grid handles hierarchical, tree-structured data well. It’s aimed at enterprise analytics apps and data-heavy dashboards with official support behind a PRO license.
Best for enterprise analytics and reporting tools.
What you get:
- Sorting and filtering
- Tree grid
- Frozen columns
- Export
Pricing: Standard edition is GPL v2 (free). PRO starts around $749.
Where it wins:
- Solid performance on large data
- Official tech support
- Enterprise focus
Where it falls short:
- GPL license on the free tier limits commercial use
- PRO needed for most real projects
What we found testing it: we ran the GPL Standard edition. Tree grid and frozen columns both performed well on our large dataset, and the enterprise orientation shows in how the hierarchical data handling is put together. We didn’t buy PRO, so support quality and the gated features are untested. The thing that stopped us short wasn’t performance, it was the license, which needs reading before a line of code goes into a commercial product.
That GPL v2 license on the free version is the catch most comparisons skip. Because GPL is copyleft, using the Standard edition in a distributed commercial product can oblige you to release your own source, which forces a PRO purchase sooner than teams expect.
Glide Data Grid – Best for rendering massive datasets fast
Glide Data Grid renders on HTML canvas instead of the DOM. That keeps six-figure row and column counts fluid where DOM-based grids drop frames.
Best for React apps pushing hundreds of thousands of rows.
What you get:
- Canvas rendering with virtual scrolling
- Rich cell types
- TypeScript support
Pricing: Free, open-source (MIT).
Where it wins:
- Exceptional large-data performance
- Rich rendering, and free
Where it falls short:
- React-only
- The canvas approach complicates deep customization, and because cells are painted rather than rendered as DOM nodes, screen-reader accessibility needs extra work
What we found testing it: six-figure row and column counts scrolled fluidly where every DOM-based grid we tried dropped frames. Canvas rendering is the whole reason, and on raw speed at scale nothing else here matched it for free. The cost showed up when we tried to style a cell: there’s no DOM node to target, so customization means learning the drawing API rather than writing CSS. We also ran a screen reader against it and the accessibility gap is real, since there are no elements for it to walk.
Bryntum Grid – Best for complex, interactive layouts
Bryntum Grid is built around subgrids, each with its own config. That subgrid architecture is unusual and it’s the whole reason to pick it.
Best for teams building complex, layout-heavy scheduling and dashboard UIs across React, Angular, and Vue.
What you get:
- Subgrids for multi-region layouts
- Frozen rows
- Sorting and filtering
- Framework wrappers
Pricing: Commercial from around $600 per developer, license only.
Where it wins:
- Advanced layout control
- Pairs with Bryntum’s scheduler suite
- Polished
Where it falls short:
- Commercial-only with no free tier
- Overkill for simple tables
What we found testing it: we used the trial. The subgrid architecture is genuinely unusual, and for a multi-region dashboard layout it does something the flat grids here simply can’t, each region carrying its own config. It also means more setup before anything renders, and for a single ordinary table the complexity buys you nothing. Webix’s 2024 test reported it lagging on medium to large datasets, though that test was published by a competitor, so weigh it accordingly.
The subgrid model shines for multi-region UIs but adds complexity plain grids avoid.
Pricing at a glance
The commercial options side by side. All are priced per developer seat, so multiply by team size.
| Library | License | Entry Price |
|---|---|---|
| AG Grid Enterprise | Commercial | $999/dev |
| Handsontable | Commercial | ~$979/dev quote-based |
| DHTMLX PRO | Commercial | ~$749 |
| Bryntum | Commercial | ~$600/dev |
| MUI X Pro | Commercial | $180/dev/yr |
TanStack Table, Tabulator, Grid.js, and Glide Data Grid stay fully free under MIT, no strings attached.
What separates a JavaScript table library from a data grid
The line blurs, but the split decides which tool fits. One enhances or generates a standard HTML table with sorting, search, and pagination. The other is a heavier component built for editing, virtualization, and manipulating large datasets.
| Type | Core Job | Examples |
|---|---|---|
| Table library | Enhance an existing table | DataTables·Grid.js |
| Data grid | Edit and virtualize big data | AG Grid·Handsontable |
| Headless engine | Logic only, you render | TanStack Table |
The headless split matters most of the three. TanStack Table ships the state and math for sorting, filtering, grouping, and row selection, but no markup at all.
Component grids like MUI X Data Grid do the opposite, handing you a finished UI with less control.
TanStack reports 1.1 billion total downloads and roughly 28,200 GitHub stars, and its team openly partners with AG Grid rather than competing.
Vanilla JS versus framework-bound is the other divide. Tabulator runs standalone from an array or JSON source, while Glide Data Grid is React-only.
Which features decide a table library’s real capability
Column sorting, filtering, and pagination are the floor. Skip any library missing one of them.
Past that baseline, these are what separate the field:
- Inline editing: cell editing plus validation, the Handsontable specialty for spreadsheet-style entry
- Data loading: static HTML, JSON, arrays, and AJAX or server-side sources
- Output: CSV and Excel export, row selection, custom cell formatters
Two dimensions people forget: responsive layout on small screens and keyboard and screen-reader accessibility.
Bundle size is a feature cost, not a footnote. Simple Table’s 2026 breakdown puts Handsontable at 247.1 kB, heavy for mobile users.
The @tanstack/react-table package alone pulls somewhere in the region of 12 to 17 million weekly npm downloads depending on the snapshot, which signals how much teams value logic they can wrap in their own markup. That figure counts only the React adapter. TanStack’s own site reports roughly 20.5 million weekly across every framework adapter combined.
How table libraries handle large datasets without freezing the browser
Rendering thousands of rows is where libraries visibly split. The technique under the hood decides whether scrolling stays smooth or the tab locks up.
Webix’s 2024 performance test found Webix and AG Grid handled datasets of varying size cleanly, while Bryntum Grid lagged noticeably on medium to large sets. Worth noting that test was published by Webix about its own product, so weigh it accordingly and benchmark with your own data.
Virtual scrolling versus server-side data
Virtual scrolling renders only the rows currently in view, which is the default trick for thousands of client-side rows.
Server-side row models stream data in chunks instead, so the browser never holds the full set. AG Grid Enterprise leans on this for millions of rows.
Grid.js quietly supports server-side data too, a feature many assume is paid-only.
When canvas rendering beats the DOM
Glide Data Grid draws cells on an HTML canvas rather than building DOM nodes.
That keeps six-figure row and column counts fluid where DOM-based grids drop frames. The trade-off is that canvas rendering makes deep styling, customization, and accessibility harder than plain CSS on the DOM, since there are no DOM nodes for a screen reader to walk.
Framework compatibility across React, Angular, Vue, and vanilla JS
Your existing stack filters the list before features matter. A React-only grid is dead weight on an Angular build.
Stack Overflow’s 2025 survey ranks React at 44.7%, jQuery at 23.4%, Angular at 18.2%, and Vue at 17.6% among developers.
| Library | Frameworks | Model |
|---|---|---|
| Tabulator | Vanilla + React, Angular, Vue | Component |
| TanStack Table | React, Vue, Solid, Svelte, Angular | Headless |
| MUI X Data Grid | React only | Component |
| DataTables | jQuery-based | Plugin |
Tabulator and Handsontable ship official wrappers but run under vanilla JavaScript at the core, so they travel anywhere.
MUI X Data Grid and Glide Data Grid tie you to React. Fine if you’re already there, a wall if you’re not.
DataTables still carries a jQuery dependency, which fights modern single-page builds. Teams moving off it often shop for a modern DataTables replacement without the legacy weight.
React’s ecosystem pull is real: it holds around 232,000 GitHub stars versus Angular’s 97,000, which is why React-first grids keep multiplying.
Free versus commercial licensing and what it actually costs
Licensing decides more picks than features do. The model, not just the price, is what trips teams up.
| Library | Model | Entry Cost |
|---|---|---|
| TanStack, Tabulator, Grid.js | Free (MIT) | $0 |
| AG Grid | Freemium | $999/dev |
| MUI X | Freemium | $180/dev/yr |
| Bryntum | Commercial | ~$600/dev |
TanStack Table, Tabulator, Grid.js, and Glide Data Grid sit under MIT with no usage limits. On the open-core side, AG Grid Community is free with Enterprise at $999 per developer, and MUI X Pro runs $180 per developer per year (Vendr, 2026).
Two catches are worth knowing before you commit:
- The GPL catch. DHTMLX Grid’s free Standard edition uses GPL v2. Because GPL is copyleft, shipping it inside a distributed commercial product can require releasing your own source, which pushes many teams toward the roughly $749 PRO tier
- The trial trap. Handsontable’s trial lets teams build the full app, then face a quote-based commercial license (reported near $979 per developer) or a rebuild
AG Grid shows the freemium pattern clearly. Most teams run Community indefinitely and buy Enterprise only for two or three gated features like the server-side row model.
FAQ on JavaScript Table Libraries
What is a JavaScript table library?
It’s a tool that adds features like sorting, filtering, and pagination to an HTML table. Some enhance existing tables, others render full data grids from JSON, arrays, or AJAX sources.
Which JavaScript table library is best for large datasets?
AG Grid and Glide Data Grid handle the biggest loads. AG Grid uses a server-side row model, while Glide renders on canvas, keeping six-figure row counts smooth where DOM grids stall.
What is the difference between a table library and a data grid?
A table library enhances an existing table with basic interactivity. A data grid is heavier, built for inline editing, virtual scrolling, and manipulating large datasets across dashboards and admin panels.
Are there free JavaScript table libraries?
Yes. TanStack Table, Tabulator, Grid.js, and Glide Data Grid are all free under the MIT license, with no usage limits or per-developer fees for commercial projects.
What is a headless table library?
A headless library supplies the logic (sorting, filtering, grouping, row selection) but no markup or styles. TanStack Table is the main example, letting you keep full control over rendering.
Which table library works best with React?
MUI X Data Grid suits Material UI teams, Glide Data Grid handles massive data, and TanStack Table gives full rendering control. All three work well in React apps.
Do JavaScript table libraries support Angular and Vue?
Many do. Tabulator, Handsontable, AG Grid, and TanStack Table ship official wrappers for React, Angular, and Vue. Glide Data Grid and MUI X Data Grid stay React-only.
How much does AG Grid cost?
AG Grid Community is free under MIT. Enterprise is $999 per developer, adding the server-side row model, integrated charts, row grouping, aggregation, and Excel export. Licensing is per seat, so confirm both the price and whether your quote is perpetual or annual.
Which library is best for spreadsheet-style editing?
Handsontable. It delivers Excel-like inline editing, copy-paste, formulas, and cell validation, making it the pick for internal tools and data-entry screens rather than read-only tables.
Is DataTables still worth using in 2026?
For jQuery or server-rendered sites, yes. It drops onto existing tables fast and still pulls heavy npm download volume. On modern React or Vue builds, its jQuery dependency fights the framework, so newer grids fit better.
Conclusion
There’s no single winner among JavaScript table libraries. The right pick depends on your dataset size, framework, and budget.
Need Excel-style editing? Handsontable. Want total control over rendering? TanStack Table’s headless engine.
Enhancing a legacy jQuery page is a different job than virtualizing millions of rows in an enterprise dashboard.
Match the tool to the work: server-side row models for heavy data, MIT-licensed options like Tabulator or Grid.js for lean budgets, and canvas rendering when the DOM buckles.
Check the license before you commit. GPL tiers and trial traps cost more than the sticker suggests.
Test two or three against your real data. A quick prototype with actual rows tells you more than any comparison table.