Data is everywhere, but raw numbers alone rarely tell the full story. That’s where different types of charts and graphs come in—turning complex data into visual insights that are easier to understand, compare, and act upon. Whether you’re presenting sales trends, mapping geographical data, or analyzing customer behavior, knowing what types of graphs are there and when to use them can make all the difference between clarity and confusion.
In this guide, we’ll break down the most essential types of graphs and charts, explaining what they’re best suited for, how they work, and when to use them. By the end, you’ll have a solid grasp of how to transform data into compelling visuals that drive informed decisions.
Let’s dive in!
Table of Contents
Different Types of Graphs and Charts and Their Uses: An Overview
| Graph Type | Primary Use Case | Data Visualization Characteristics | Typical Data Used For | Limitations/Notes |
|---|---|---|---|---|
| Bar Chart | Comparing categories | Length of bars represent value | Categorical data | Not ideal for time series or many categories |
| Grouped Bar Chart | Comparing multiple categories | Bars grouped together for comparison | Categorical data | Not ideal for time series or many categories |
| Stacked Bar Chart | Sub-category comparison | Bars divided into sub-bars stacked on top of each other | Part-to-whole for categories | Can be complex with too many stacks |
| Radar Chart | Multivariate comparison | Axes emanating from center for each variable | Comparable quantitative variables | Confusing with too many variables/spikes |
| Mekko Chart | Market data proportions | Bar widths and heights represent different relationships | Market segmentation data | Complex and hard to read |
| Nightingale Rose Chart | Proportions and cyclic data | Circular chart with wedges representing data | Frequency of data at different times | Can be misleading when there are too many wedges |
| Venn Diagram | Set relationships | Overlapping circles to show commonality | Statistical, probabilistic data | Overlapping only effective for a few sets |
| Histogram | Distribution of numerical data | Bars represent frequency of data in intervals | Continuous data | Cannot show developments over time |
| Density curve | Distribution analysis | Smooth curve showing probability density | Continuous numerical data | Assumes smoothness of data, may not represent real-world variations |
| Box Plot | Statistical distribution | Visual summary of data quartiles and outliers | Quantitative data | Not for detailed distribution analysis |
| Violin Plot | Distribution comparison | Combination of box plot and density curve | Continuous data | Can become cluttered with too many categories |
| Dot Plot | Comparing frequency or count | Dots represent quantities | Comparative discrete data | Less informative for continuous data |
| Line Chart | Time series trends | Points connected by lines show change over time | Sequential data | Can be cluttered with too many variables |
| Spline Chart | Smooth trends | Curved lines connecting data points | Sequential data with smooth trends | Can mislead as it implies smoothness between points |
| Scatter Plot | Relationship between variables | Dots represent value pairs | Bivariate quantitative data | Less effective for categorical data |
| Polar Chart | Comparing data in a circular format | Data plotted along a radial axis | Cyclical or angular data | Difficult to compare many categories |
| Bubble Chart | Multivariable relationships | Dots with size variation | Tri-variate data | Can get cluttered, hard to read |
| Parallel Coordinates Plot | Multivariable relationships | Data plotted as lines on parallel axes | High-dimensional data | Can be cluttered with too many variables |
| Area Chart | Cumulative trends | Filled area between line and axis, stacked possible | Sequential data, part-to-whole | Can be hard to read if stacked |
| Stream Graph | Data flow visualization | Flow lines that change shape over time | Time series data | Hard to interpret with many flows |
| Heat Map | Data density and patterns | Color-coded values | Matrix data, comparisons | Not precise for individual value reading |
| Candlestick Chart | Financial data trends | Bars representing open, close, high, and low values | Stock market, financial analysis | May not be suitable for general data |
| Dual Axis Chart | Comparing two variables with different scales | Two different Y axes for different data scales | Two distinct data types | Can mislead if scales are not labeled carefully |
| Cartesian Graphs | Plotting mathematical functions, relationships | X and Y axes with points or lines | Mathematics, science data | Requires understanding of xy-coordinate system |
| Spiral Plot | Time series with cyclical patterns | Data plotted in a spiral format | Cyclical data | Can be hard to interpret with long time spans |
| Pie Chart | Proportions/percentages | Circular chart divided into sectors | Part-to-whole relationships | Not for comparisons, bad with many slices |
| Donut Chart | Proportions/percentages | Circular chart with a hole in the center | Part-to-whole relationships | Not for comparisons, bad with many slices |
| Funnel Chart | Process stages and completion rates | Truncated cone, each segment a process stage | Sales pipeline, conversion rates | Difficult with too many stages |
| Waterfall Chart | Sequential changes | Connected bars showing positive and negative changes | Financial statements, inventory | Mainly for financial or inventory analysis |
| Pictograph | Representing data with icons | Icons to represent data values | Education, simple comparisons | Not for complex or precise data |
|
Proportional Area Chart |
Part-to-whole relationships | Sizes of areas represent proportions | Hierarchical, part-to-whole | Can become hard to read if too many elements are added |
| Square Area Chart | Part-to-whole relationships | Rectangular areas represent values | Part-to-whole, categorical data | Can be less intuitive than traditional pie or bar charts |
| Organizational Chart | Displaying hierarchies | Diagram showing structure of an organization | Corporate or group structures | Not for data analysis, just structure |
|
Circle Packing |
Hierarchical data | Nested circles of varying sizes | Hierarchical data | Can be hard to interpret with large datasets |
| Pyramid Graph | Hierarchical relationships, often demographics | Triangular chart with sections | Population structures, processes | Limited to processes with a clear hierarchy |
| Treemap | Hierarchical data | Nested boxes of varying sizes and colors | Hierarchical, part-to-whole | Hard to track once segmentations grow |
| Sunburst Chart | Hierarchical data | Nested rings representing hierarchical relationships | Hierarchical data | Can become too cluttered with many layers |
| Sankey Diagram | Flow quantity | Width of arrows proportional to flow quantity | Energy, material, cost flows | Requires good data structuring |
| Flow Chart | Processes or workflows | Diagram with steps in a process | Decision paths, processes | Can become complex with many steps |
| Gantt Chart | Project timelines | Horizontal bars against time axis | Schedules, milestones | Mainly for project management |
| Chord Diagram | Visualizing relationships | Curved lines connecting segments of a circle | Relationships between entities | Difficult to interpret with too many relationships |
| Network Diagram | Visualizing networks and relationships | Nodes connected by edges | Network analysis, social networks | Can become overwhelming with large networks |
| Connection Map | Relationship and flow mapping | Lines showing connections between entities | Network data, relationships | Can get cluttered with too many connections |
|
Map-based plots |
Geospatial data | Plotting of data on geographic maps | Location-based data | Can be misleading without proper scale and labeling |
|
Choropleth map |
Geospatial data with shading | Geographic areas shaded based on data values | Demographic, geographical data | Difficult to interpret without proper scale |
|
Geo chart |
Geospatial data | Data points plotted on geographic maps | Location-based data | May require interactive features for full usefulness |
|
Dot map |
Geospatial data | Dots represent data points on a map | Location-based data | Can become cluttered in dense areas |
|
Flow map |
Geospatial flow data | Lines or arrows showing movement across a map | Movement data (e.g., traffic, migration) | Can become messy with too many flow paths |
| Bullet Chart | Performance against target | Bar with performance marks and target | Performance metrics | Limited to simple performance tracking |
| Gauge Charts | Data within a predetermined range | Semi-circular or circular dial | Performance against a goal | Limited data representation per chart |
|
KPI chart |
Key performance indicators (KPIs) | Displays single metric values, often with goals/trends | Business performance, metrics tracking | Best for high-level insights, not for detailed data analysis |
Free Chart Type Picker
Comparison Charts
Comparison charts help visualize differences between categories, making it easy to compare values at a glance. Whether you’re analyzing sales performance, tracking trends across multiple groups, or showcasing survey results, these charts provide a clear, structured view of data relationships.
From bar charts that highlight categorical comparisons to bullet charts for progress tracking and pyramid graphs that illustrate hierarchical data, these types of charts ensure that insights are easy to interpret and act upon.
Bar chart
Chart created with wpDataTables
A bar chart is your visual shot of espresso for comparison between different groups or categories. Each bar’s height or length varies according to its value, straight up showcasing differences in a way that’s easy to grasp.
What to use it for:
- Comparing product sales
- Showing survey results
- Tracking changes over time with different groups
Tips for creating one:
- Label your axes clearly
- Use contrasting colors for different categories
- Keep it simple; avoid cluttering with too much text
What we like about it: The simplicity – a bar chart is easy to create and it’s the classic, clear-cut choice when you want immediate comparisons without the frills.
Grouped bar chart
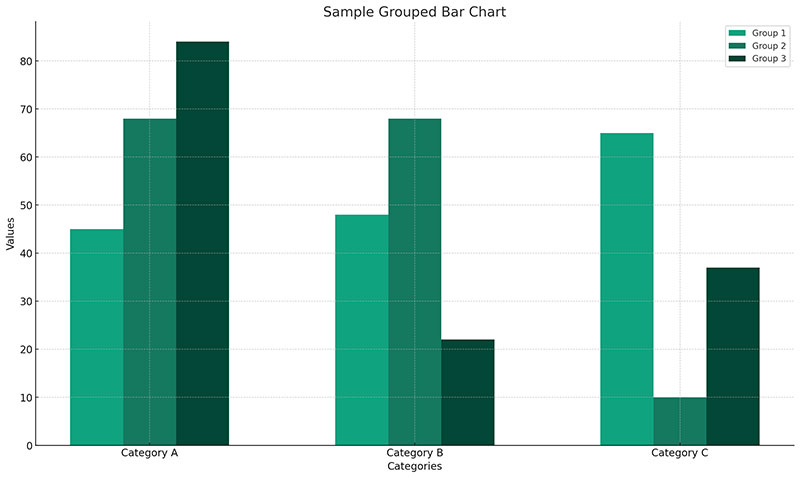
Grouped bar charts are the perfect way to compare multiple categories side by side, allowing for clear comparison across different groups or time periods.
What to use it for:
- Comparing multiple categories or subgroups
- Displaying changes over time
- Showing performance across different categories or groups
Tips for creating one:
- Label each group clearly
- Ensure the categories are aligned and easy to compare
- Use distinct colors for different bars to increase clarity
What we like about it: Grouped bar charts make it easy to compare categories at a glance, providing a straightforward visualization for complex data sets.
Stacked bar chart
Chart created with wpDataTables
Got segments within segments? Stacked bar charts have you covered, upgrading the traditional bar chart by stacking different data segments on top of one another. They’re your deep-dive into categorical subdivision at first sight.
What to use it for:
- Showcasing total sales while breaking down different product contributions
- Exploring parts of a whole over time or categories
- Comparing total values while seeing segment proportions
Tips for creating one:
- Stick to a clear color palette for different segments
- Keep segment order consistent across bars
- Label segments clearly for readability
What we like about it: The layered insights these types of charts provide—it’s like getting the inside scoop on each category while still seeing the big picture.
Radar chart (Spider chart)
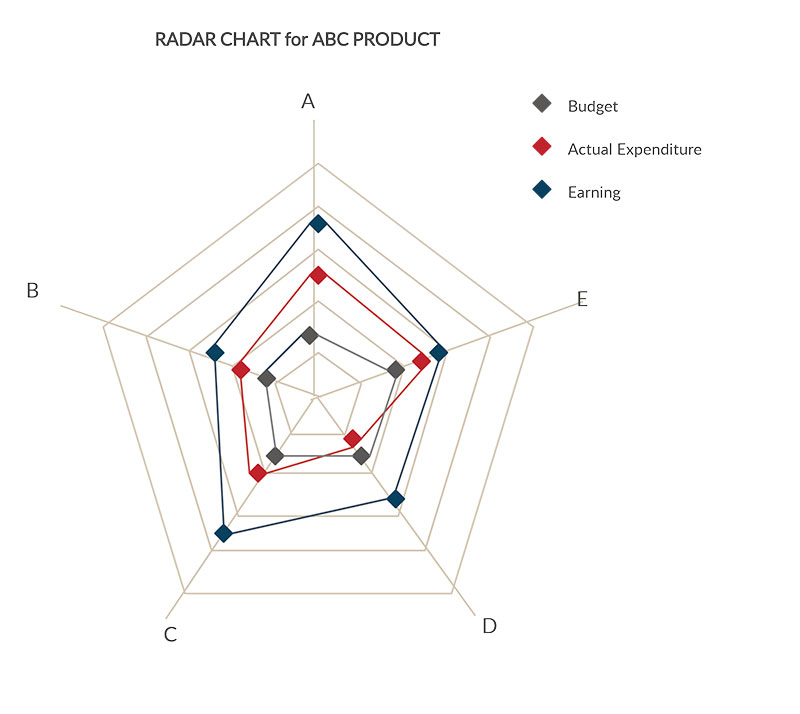
Radar charts, also known as spider charts because of their web-like appearance, are about comparing multivariate data. Picture a super spy’s gadget screen, with each axis representing different attributes for comparison.
What to use it for:
- Comparing attributes of different products or services
- Assessing performance across multiple areas
- Skill evaluations for people or teams
Tips for creating one:
- Limit the number of variables to keep it legible
- Standardize your scales for accurate comparison
- Use contrasting colors for different datasets
What we like about it: Its 360-degree view—radar charts let you see all facets of your data in one unified visual circle.
Mekko chart
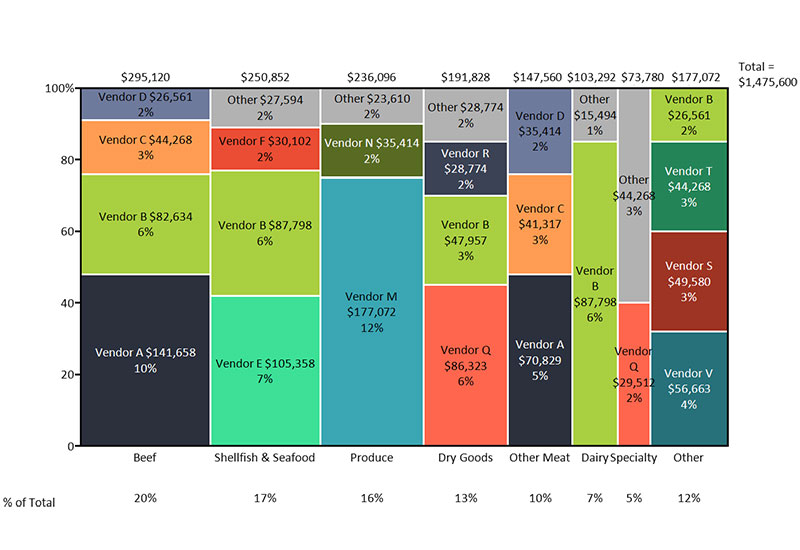
Mekko Charts, also called Marimekko or Market Maps, are the bar charts that wanted to show a bit more. These chart types highlight not only categories but also their composition and comparative size.
What to use it for:
- Displaying market segmentation
- Analyzing resource allocations
- Presenting revenue streams
Tips for creating one:
- Color-code to show category compositions
- Keep label text clear and legible
- Focus on widths and heights for accuracy
What we like about it: Its layered insight—Mekko Charts deliver a rich visual of your data’s complexities, making comparisons a breeze.
Nightingale rose chart
A Nightingale rose chart is a variation of the polar chart, providing a circular representation of data that emphasizes proportions with radial bars.
What to use it for:
- Showing proportions or frequencies in a visually striking way
- Comparing categories across circular space
- Representing cyclical data patterns
Tips for creating one:
- Ensure that data segments are proportionally accurate
- Use a limited number of categories to maintain clarity
- Choose an effective color scheme to make each section distinct
What we like about it: Nightingale Rose charts make proportion-based data visually engaging, offering a dynamic alternative to bar charts.
Venn diagram
Venn diagrams are masters of intersecting worlds, cleverly showing commonalities and differences with overlapping circles. It’s a relationship exploration that says, “Let’s see where we meet and where we part ways.”
What to use it for:
- Examining correlations between groups
- Identifying shared characteristics
- Comparing product features or market segments
Tips for creating one:
- Keep overlaps clear and balanced
- Use contrasting colors for various groups
- Label each section for easy identification
What we like about it: The overlap magic—Venn diagrams make understanding complex relationships seem like a walk in the park.
Distribution Charts
Distribution charts reveal how data points are spread across a range, helping to identify patterns, trends, and outliers. They are essential for understanding the shape of data, whether it clusters around a central value or skews in a particular direction.
These types of charts make it easy to spot anomalies, compare distributions, and analyze variability. Whether you’re assessing customer demographics, financial trends, or scientific measurements, distribution charts provide clarity in complex datasets.
Histogram
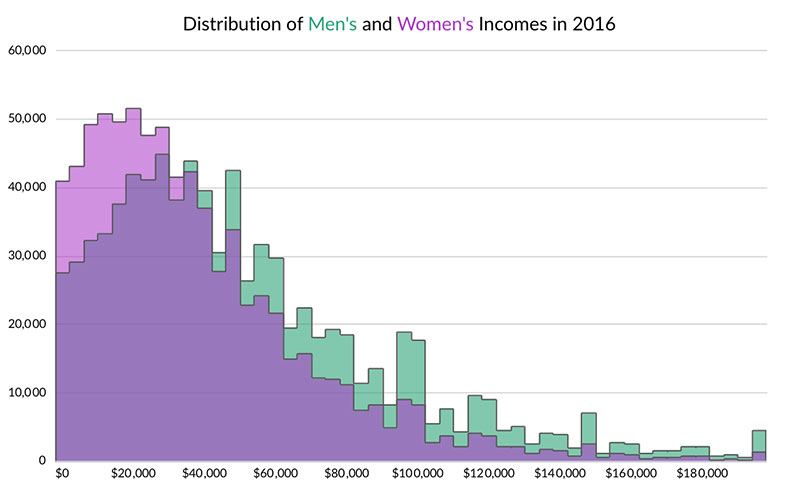
Our trusty histogram is all about showing frequency—the number of results in sequential numeric data ranges. Think bars holding hands; there are no spaces between them because they’re displaying a continuous range.
What to use it for:
- Presenting age distribution
- Showing income ranges in a population
- Analyzing test scores’ spread
Tips for creating one:
- Ensure your bins (ranges) make sense for your data
- Start your first bin at zero
- Keep your bin width consistent
What we like about it: The clarity in showcasing data distribution—histograms make spotting the most common ranges straightforward and satisfying.
Density curve
A density curve is a smooth, continuous line that shows the distribution of your data. It’s like a mountain range that rises higher where the data points are densest and flattens out where they’re sparse.
What to use it for:
- Displaying the distribution of data points.
- Identifying patterns, peaks, and data outliers.
- Comparing the distributions of two or more datasets.
Tips for creating one:
- Use a fine-tuned bandwidth to ensure smoothness without over-smoothing.
- Make sure the curve represents the real distribution, not just a smoothed approximation.
- Compare multiple datasets on the same graph for easy contrast.
What we like about it: The clear, flowing representation of your data distribution—density curves help reveal hidden patterns that other charts may miss.
Box plot (Box-and-Whisker plot)

The box plot, the unsung data hero, captures a five-number summary in a glance—minimum, first quartile, median, third quartile, and maximum. It’s a statistical treasure chest, unlocking distribution insights at speed.
What to use it for:
- Statistical analyses across different groups
- Spotting outliers or anomalies in data sets
- Comparing distributions between multiple sets
Tips for creating one:
- Clearly mark the median and quartiles
- Use whiskers to show the range
- Highlight outliers for added insight
What we like about it: The sheer data depth—box plots reveal distribution details that other chart types simply can’t touch.
Violin plot
A violin plot takes the box plot to the next level, showing both the summary statistics (like quartiles) and the distribution of the data. It’s a hybrid, combining a box plot with a density curve, shaped like a violin.
What to use it for:
- Comparing distributions between categories.
- Visualizing data spread and density in one view.
- Identifying skewness or multimodal data patterns.
Tips for creating one:
- Use for datasets with multiple categories or groups.
- Pay attention to the width of the “violin”—this shows the data density.
- Use side-by-side violins to compare distributions.
What we like about it: The violin plot gives you more than just summary statistics—it shows you the full picture of how your data is distributed, making it perfect for comparing multiple groups at once.
Dot plot

Dot plots are the minimalist’s dream, breaking down data into simple dots along a line. These graph types tell a clear story about frequency and distribution without any superfluous details.
What to use it for:
- Showing small data set frequencies
- Comparing group sizes
- Spotting trends and clusters
Tips for creating one:
- Use a single axis for simplicity
- Keep dot sizes consistent
- Allow sufficient space between dots for differentiation
What we like about it: The simplicity—dot plots deliver clean, straightforward insight into your data’s building blocks.
Trend & Relationship Charts
Trend & relationship charts help uncover connections between variables and track changes over time. These charts are essential for spotting correlations, identifying patterns, and predicting future outcomes.
Whether you’re analyzing stock market trends, customer behavior, or sales growth, they provide a clear visual representation of how data points interact. By highlighting upward or downward trends and revealing hidden relationships, these charts turn raw data into actionable insights.
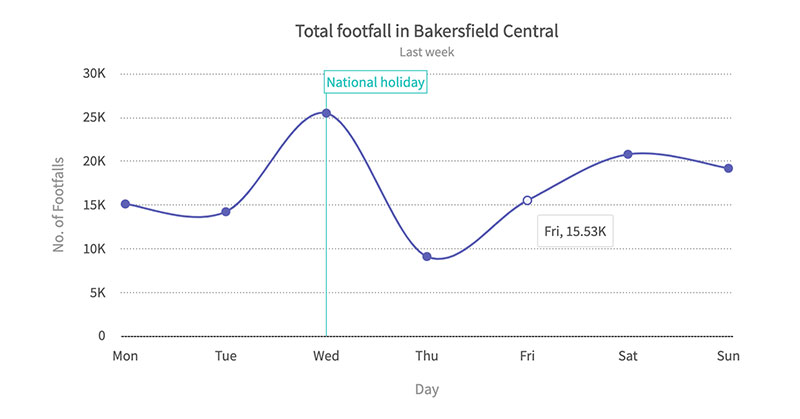
Line chart
Chart created with wpDataTables
Imagine your data points holding hands across a page; that’s your line chart. It’s about watching trends and changes over time, with a line that flows across the data points, often revealing patterns you might miss in a table.
What to use it for:
- Monitoring stock market trends
- Tracking website traffic over months
- Comparing performance metrics over time
Tips for creating one:
- Keep your line paths smooth
- Highlight significant points or changes
- Limit the number of lines to avoid confusion
What we like about it: The versatility and clear visual of trends—line charts can tell a time story like no other.
Spline chart
Imagine a line chart got a makeover to smooth things out. That’s your spline chart, with lines curving gracefully between data points, offering a polished view on trends.
What to use it for:
- Smoothing out fluctuations in data
- Displaying refined trend lines
- Enhancing visual appeal for presentations
Tips for creating one:
- Use control points to adjust curves
- Keep the curve changes intuitive
- Highlight significant data trends
What we like about it: The aesthetic finesse—spline charts take the edge off sharp turns, delivering a delightful visual flow.
Scatter plot
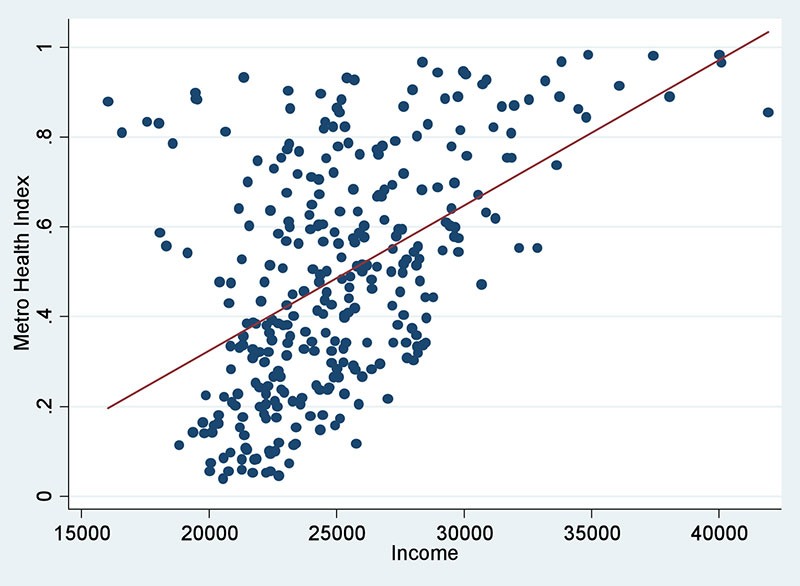
The scatter plot is the renegade artist of the data world, throwing dots across a grid to show us the relationship between two variables. Where the dots fall, a story is told, revealing correlations or intriguing clusters.
What to use it for:
- Spotting correlations between variables
- Identifying data outliers
- Analyzing research data sets
Tips for creating one:
- Keep your axes scaled proportionally
- Use dots that are easy to differentiate
- Include trend lines if applicable
What we like about it: The depth of analysis it permits—scatter plots give us a bird’s-eye view of complex variable relationships.
Polar chart
Polar charts are designed to visualize data that is cyclical or exhibits a relationship between multiple variables in a circular format. These types of charts provide a unique way of displaying data with a radial structure, often used to illustrate trends, patterns, and comparisons.
What to use it for:
- Visualizing cyclic or periodic data (e.g., weather patterns, time of day trends)
- Showing multivariate data in a circular layout (e.g., performance data across multiple categories)
- Comparing data points relative to a central value or angle
- Highlighting data trends or variations around a circle
Tips for creating one:
- Ensure data points are well-organized by angles (usually in increments like 30°, 45°, etc.)
- Use clear labels or legends to identify each axis or category for easy interpretation
- Keep the number of data points balanced to prevent clutter and maintain clarity
- Consider using radar or spider charts, which are a type of polar chart, for displaying comparative performance or characteristics of multiple items
What we like about it: Polar charts bring a fresh perspective to data visualization, enabling a circular view of trends or relationships that linear charts cannot easily express. Their unique layout makes it easier to identify patterns that repeat in a cyclical nature and is especially useful in performance analysis or showing how data fits within a circular progression.
Bubble chart
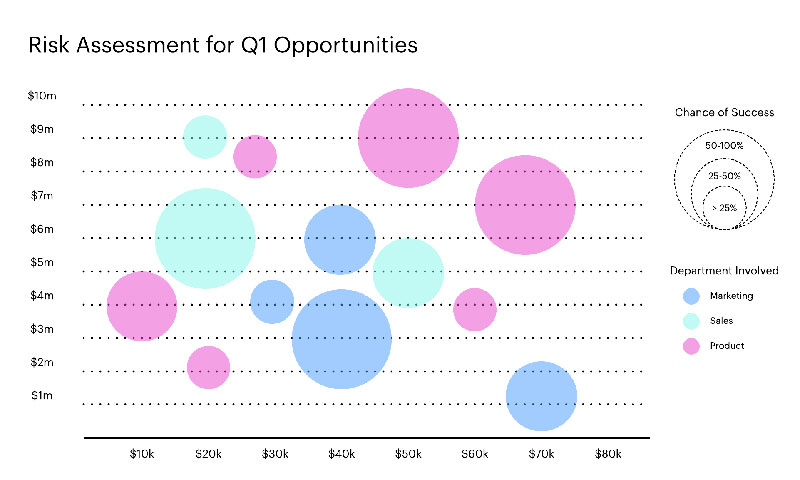
Bubble charts are the free spirits—mixing the detail of scatter plots with the added oomph of bubble size to represent a third data dimension. They make patterns and relationships pop in multidimensional glory.
What to use it for:
- Multi-variable analysis
- Displaying social, economic, health, and scientific data sets
- Revealing complex data relationships
Tips for creating one:
- Keep a consistent scale for bubble sizes
- Select distinct colors for different data sets
- Ensure text labels are legible
What we like about it: The third dimension of context—the size aspect adds a layer of nuance that elevates data storytelling.
Parallel coordinates plot
Parallel coordinates plots are one of those types of graphs which are excellent for visualizing multi-dimensional data. This is because they display each data point along parallel axes.
What to use it for:
- Analyzing multi-dimensional relationships in datasets
- Identifying trends, clusters, or outliers across variables
- Comparing several dimensions at once
Tips for creating one:
- Use consistent scaling for all axes
- Highlight key data points or trends for better visibility
- Avoid too many variables to keep the plot readable
What we like about it: Parallel coordinates plots allow for in-depth analysis of complex data, showing multidimensional relationships at a glance.
Area chart
Chart created with wpDataTables
An area chart takes the stage with the flair of a line chart but throws in some color beneath the line. This chart is all about volume—the filled area helps viewers quickly see total value changes over time.
What to use it for:
- Highlighting volume change over time
- Understanding specific part-to-whole relationships within larger trends
- Stacking multiple data sets to compare changes
Tips for creating one:
- Use semi-transparent colors if layering multiple sets
- Keep your y-axis clear
- Highlight key data points on your line
What we like about it: The drama—area charts bring a dynamic visual punch, emphasizing the magnitude of changes over time.
Stream graph
Stream graphs are graph types that represent data over time, where layers of data flow along a stream, creating an engaging, flowing visualization.
What to use it for:
- Visualizing changes over time for multiple categories
- Showing how different parts of a whole evolve
- Tracking trends and patterns in a fluid, engaging way
Tips for creating one:
- Use a smooth color gradient to represent different categories
- Avoid overlapping streams to keep the graph clear
- Ensure the time axis is well-labeled for context
What we like about it: Stream graphs offer a fluid, visually captivating way to track the rise and fall of data over time.
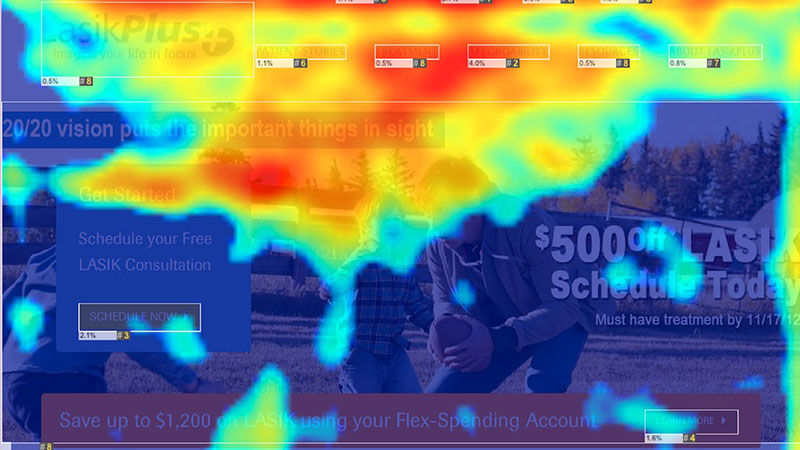
Bring the warmth with a heat map, where colors aren’t just pretty—they’re telling you a story. This chart uses color shades to show value differences across a two-dimensional surface. It’s intuitive: the warmer the color, the higher the value.
What to use it for:
- Visualizing complex data matrices
- Revealing patterns or performance across different variables
- Observing geographic data distribution
Tips for creating one:
- Choose your color gradient wisely
- Avoid using too many color shades to maintain clarity
- Annotate for context where necessary
What we like about it: The instant ‘aha!’ moment—heat maps make spotting trends and outliers a walk in the park.
Candlestick chart
Candlestick charts are the go-to for visualizing financial data, especially in the stock market, representing price movements over time.
What to use it for:
- Tracking stock prices or market trends
- Showing price open, high, low, and close for each time period
- Analyzing market trends and volatility
Tips for creating one:
- Use a consistent time frame (e.g., daily or weekly)
- Choose distinct colors to differentiate between upward and downward movements
- Include context like volume or moving averages
What we like about it: Candlestick charts are essential for financial analysis, providing rich information on market behavior in a compact form.
Dual axis chart
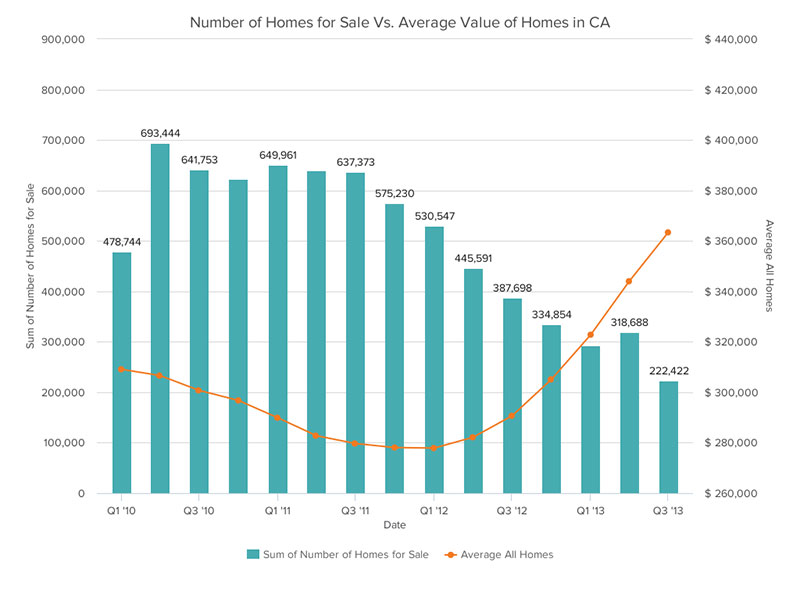
When two datasets want to share the spotlight on a single stage, the dual axis chart lets them. You’ve got two Y-axes, playing side by side but each dancing to their rhythm.
What to use it for:
- Comparing variables with different units or scales
- Showcasing relationships between two distinct data sets
- Identifying correlations and disparities
Tips for creating one:
- Clearly distinguish the two Y-axes and scale them adequately
- Use different chart styles for each data set
- Add labels and legends for clarity
What we like about it: The duality—the dual axis chart is like having two charts in one, doubling your insights.
Cartesian graphs
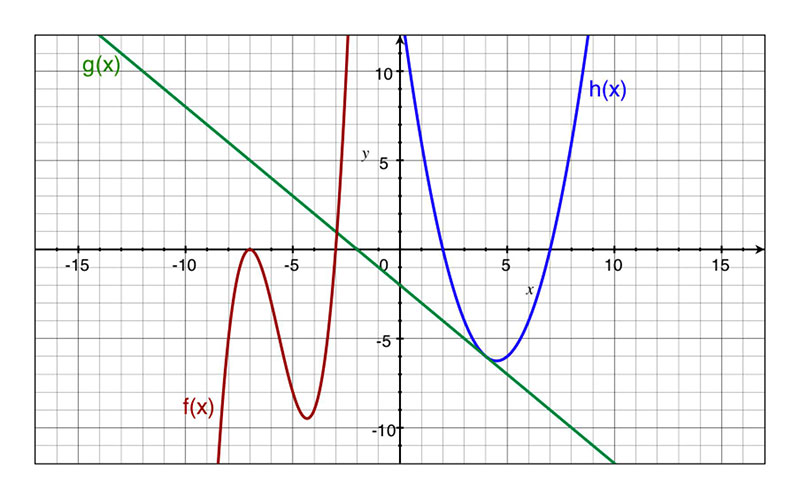
Cartesian graphs are the granddads of the graphing world. With their x and y-axes, they’re about plotting points on a grid to see where values land.
What to use it for:
- Mapping out algebraic functions
- Plotting geographical coordinates
- Displaying changes in variable relationships
Tips for creating one:
- Clearly mark your axes with units
- Use a grid for easier point placement
- Highlight important data points
What we like about it: The foundation it provides—Cartesian graphs are the base of many other graph types, a reliable classic in the world of data.
Spiral plot
Spiral plots provide a visually appealing way to track data over time, often used for cyclical or seasonal patterns.
What to use it for:
- Visualizing data with cyclical patterns (e.g., seasons, months)
- Showing trends over time in a spiraling format
- Analyzing periodic data or events
Tips for creating one:
- Ensure time intervals are evenly spaced
- Use a smooth color gradient to represent data changes
- Keep the spiral simple for readability
What we like about it: Spiral plots are a creative and captivating way to visualize time-based trends, making seasonal or cyclical patterns easier to spot.
Part-to-Whole Charts
Part-to-whole charts break down data into individual components to show how each piece contributes to the whole. These charts are ideal for visualizing proportions, distributions, and compositions in a dataset.
Whether comparing market share, budget allocations, or survey responses, they provide an intuitive way to understand relationships between categories. By making percentages and segment sizes easy to grasp, part-to-whole charts help in decision-making and strategic planning.
Pie chart
Chart created with wpDataTables
Fancy a visual slice of something whole? Enter the pie charts. It takes a full circle, the ‘pie,’ and divides it into color-coded ‘slices.’ Each slice size corresponds to its portion of the whole, making it a delicious choice for showing percentages.
What to use it for:
- Displaying market share among competitors
- Illustrating a budget breakdown
- Showing demographic segmentation
Tips for creating one:
- Limit the number of slices to keep things readable
- Use contrasting colors
- Put the largest slice at 12 o’clock and work around
What we like about it: The immediate visual impact—it’s a globally understood, quick way to digest part-to-whole relationships.
Donut chart
Donut charts are similar to pie charts but with a hole in the center, offering a cleaner, more visually appealing representation of proportions.
What to use it for:
- Displaying parts of a whole
- Showing proportions in a compact format
- Representing data that fits within a circle
Tips for creating one:
- Limit the number of segments to avoid clutter
- Use contrasting colors for easy comparison
- Label segments clearly for better readability
What we like about it: Donut charts are a modern take on pie charts, offering a sleek look while still conveying proportional relationships.
Funnel chart
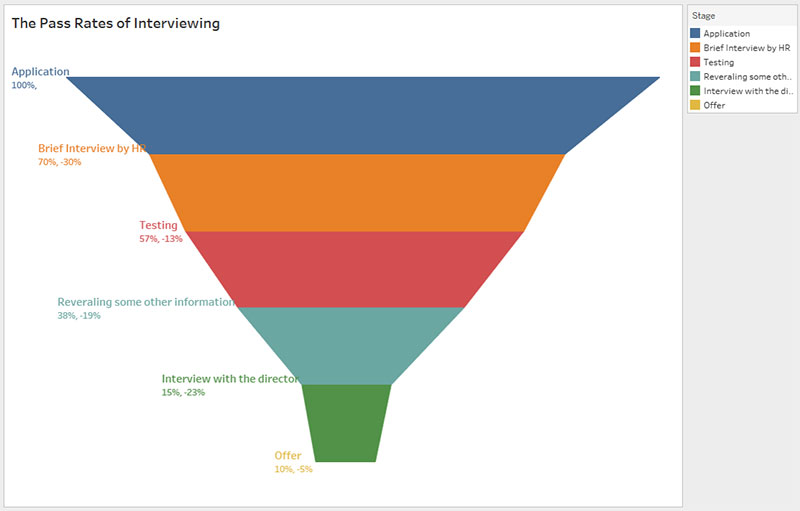
Represent your process stages with a Funnel Chart—a visual trip from the broad beginning to the narrowed-down end. It shows progression, drop-offs, and bottlenecks, keeping things moving and improving.
What to use it for:
- Mapping sales processes
- Analyzing website conversions
- Tracking lead generation
Tips for creating one:
- Clearly show each stage of the process
- Use gradient colors to represent progression
- Highlight areas where changes occur
What we like about it: The process insight—funnel charts elegantly pinpoint where things flow smoothly and where to troubleshoot.
Waterfall chart
The waterfall chart is like a financial storybook, illustrating a starting value and the sequential impact of positive or negative values that lead to a final result. It’s transparency and insight in a unique visual flow.
What to use it for:
- Understanding income statements
- Displaying cumulative effect of sequentially introduced values
- Analyzing inventory or sales numbers
Tips for creating one:
- Start with a clear initial value column
- Use descending or ascending order for the flow of values
- Keep a distinct color for increases and decreases
What we like about it: Its sequential storytelling—waterfall charts drill down into the why’s and how’s behind final numbers.
Pictograph
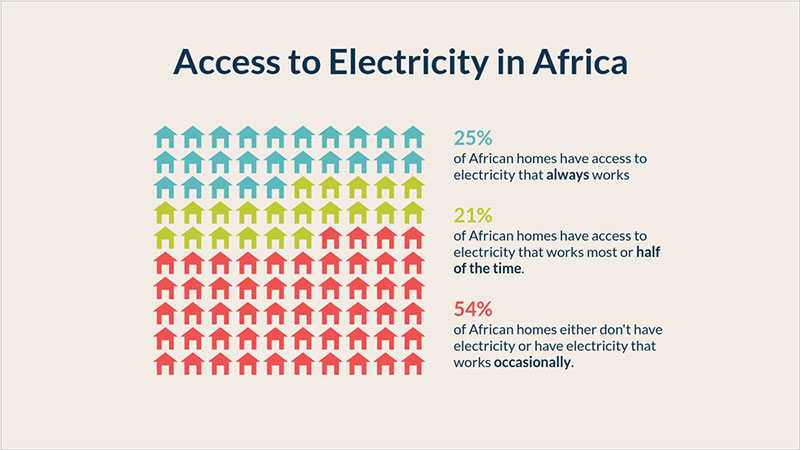
A picture is worth a thousand words, and pictographs take that to heart. Using icons or images to represent data quantities, they bring a dose of visual fun to stats and facts.
What to use it for:
- Educating young audiences
- Presenting survey data engagingly
- Highlighting social media engagement
Tips for creating one:
- Choose universally recognizable icons
- Keep the icon size consistent for accurate representation
- Add a key to explain icon values
What we like about it: The playful nature of these types of graphs—pictographs turn data into a visual party, inviting everyone to the celebration.
Proportional area chart
Proportional area charts use varying sizes of shapes (typically circles) to represent the proportion of categories in a dataset, giving a visual sense of scale.
What to use it for:
- Showing proportions in a dataset
- Representing relative sizes of categories or groups
- Comparing multiple categories in terms of volume or quantity
Tips for creating one:
- Make sure the area accurately reflects the data proportions
- Use color to distinguish categories
- Label the areas for clarity
What we like about it: Proportional area charts are excellent for representing relative sizes visually, making comparisons simple and intuitive.
Square area chart
Square area charts are similar to proportional area charts but use square shapes instead of circles, emphasizing category sizes in a rectangular form.
What to use it for:
- Representing data proportions in a more squared format
- Comparing multiple categories with visual emphasis on size
- Displaying hierarchical or grouped data in a compact format
Tips for creating one:
- Use equal-sized squares for consistency
- Keep the chart simple by limiting the number of categories
- Label squares clearly to ensure easy interpretation
What we like about it: Square area charts provide an interesting and space-efficient way to display proportions, making them visually striking.
Hierarchical charts
Hierarchical charts showcase relationships between data points in a structured, top-down, or nested format. These types of charts are perfect for visualizing organizational structures, decision trees, and category breakdowns, making complex relationships easier to understand.
Whether mapping company hierarchies, product taxonomies, or data classifications, they help illustrate how elements are connected and organized within a system.
Organizational chart
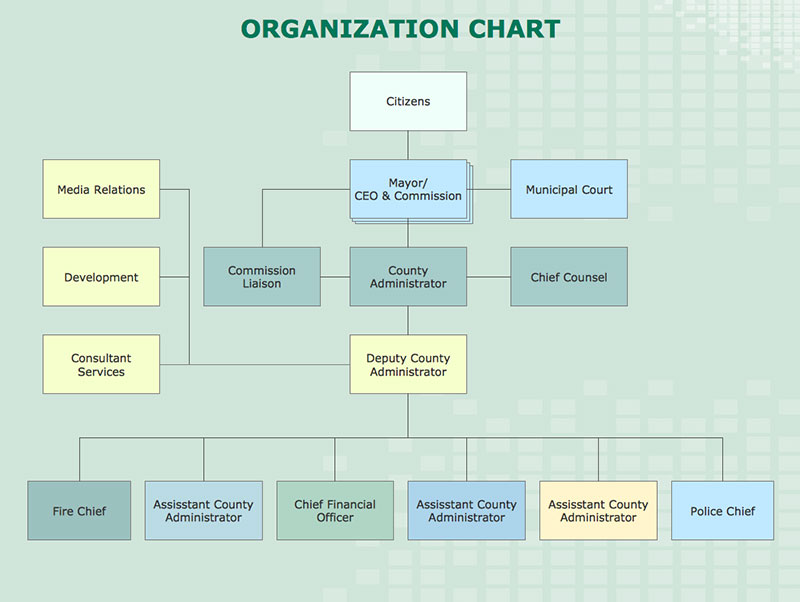
Mapping out the corporate jungle, organizational graphs are the who’s who of who reports to whom. They visualize the company tree with all its branches right down to the last leaf.
What to use it for:
- Detailing company hierarchies
- Clarifying roles and responsibilities
- Onboarding new employees
Tips for creating one:
- Update regularly with personnel changes
- Use color coding for different departments
- Keep the design clean for easy navigation
What we like about it: The clarity it brings—the organizational graph turns complex structures into a navigable map.
Circle packing
Circle packing is a creative way to display hierarchical data using nested circles to represent various categories and subcategories.
What to use it for:
- Displaying hierarchical or nested data
- Highlighting the relative size of categories within a hierarchy
- Comparing parts of a whole across multiple levels
Tips for creating one:
- Use distinct colors for each level of the hierarchy
- Ensure the circles are sized proportionally
- Label the circles clearly for easy understanding
What we like about it: Circle packing provides a compact and visually appealing way to display nested relationships, emphasizing relative sizes.
Pyramid graph
Visualize your hierarchy with a pyramid graph, where each section represents a different level or component within a larger system. This graph type is like a corporate ladder or a food chain, neatly packed into a triangle.
What to use it for:
- Displaying organizational structures
- Illustrating food chains or energy hierarchies
- Showing demographic distributions
Tips for creating one:
- Make the largest base section represent the largest segment
- Use gradients or colors to distinguish levels
- Add labels for each section for clarity
What we like about it: The crystal-clear hierarchy—it’s visual storytelling from the ground up, or should we say, from the base up.
Treemap
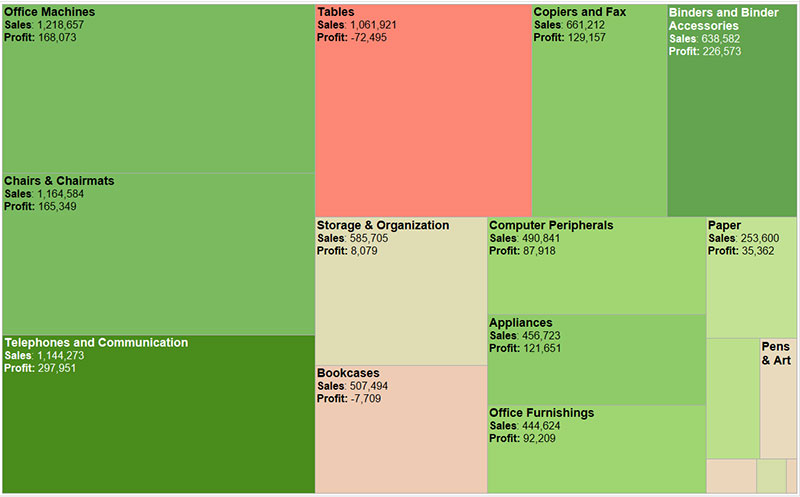
Imagine a visual organizer for your data, breaking it down into nested rectangles. Larger boxes catch the eye first, with each rectangle’s size reflecting its value proportion. It’s a sleek way to compare parts in a whole.
What to use it for:
- Displaying hierarchical data
- Illustrating proportions within a dataset
- Visualizing budget allocations or market segmentation
Tips for creating one:
- Use color coding meaningfully to represent different categories
- Keep your labels concise
- Order your rectangles to reflect the data hierarchy
What we like about it: The neat breakdown—it’s like turning a complex spreadsheet into an easily digestible art piece.
Sunburst chart
Sunburst charts are hierarchical visualizations that work like tree maps, providing a circular view of hierarchical data.
What to use it for:
- Representing hierarchical structures in data
- Visualizing nested categories in an easy-to-understand format
- Tracking the distribution of a whole across multiple levels
Tips for creating one:
- Use concentric rings to represent hierarchical levels
- Label segments clearly to avoid confusion
- Limit the number of levels to maintain clarity
What we like about it: Sunburst charts offer a compact and visually appealing way to understand hierarchical data structures.
Flow & connection charts
Flow & connection charts illustrate the movement, relationships, and dependencies between data points, making them ideal for tracking processes, resource flows, and network interactions. These charts help visualize how information, goods, or influence travel through a system, highlighting bottlenecks, efficiencies, and key touchpoints.
Whether mapping customer journeys, supply chains, or digital networks, they provide clarity on how different elements are connected and interact over time.
Sankey diagram
Sankey diagrams flaunt the flow of energy, materials, or costs between processes. With arrows widening and narrowing, these types of graphs capture the magnitude of flow visually. It’s data transforming into a river system map, ebbing and flowing through channels.
What to use it for:
- Analyzing energy transfer
- Tracking supply chain logistics
- Visualizing traffic flow or user navigation paths
Tips for creating one:
- Make your flow directions easy to follow
- Use weight variations in arrows to represent different flow volumes
- Keep your colors consistent for similar flow types
What we like about it: The flow dynamics—it’s a power move to track where and how resources get channeled in complex systems.
Flow chart
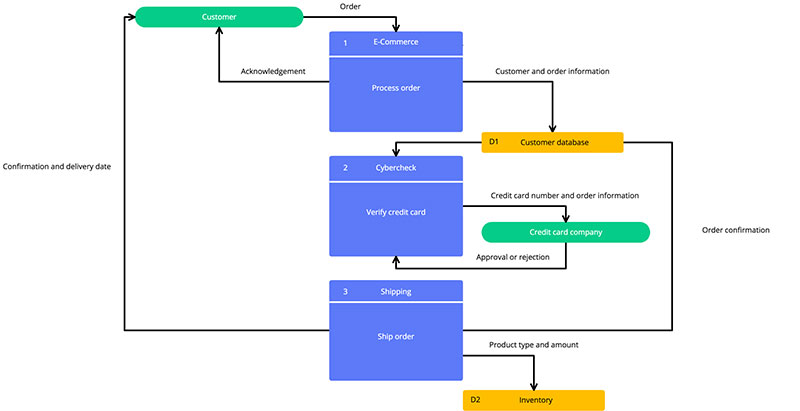
Flow charts are the GPS in the world of processes and decision-making. They use symbols and arrows to guide you step-by-step, anticipating every turn in the road.
What to use it for:
- Outlining processes or workflows
- Demonstrating decision-making paths
- Clarifying complex methodologies
Tips for creating one:
- Keep the flow direction consistent
- Use standard symbols for actions and decisions
- Make sure the chart is easy to read
What we like about it: The roadmap it creates—Flow Charts avoid process-related pile-ups, ensuring smooth navigation through tasks.
Gantt chart
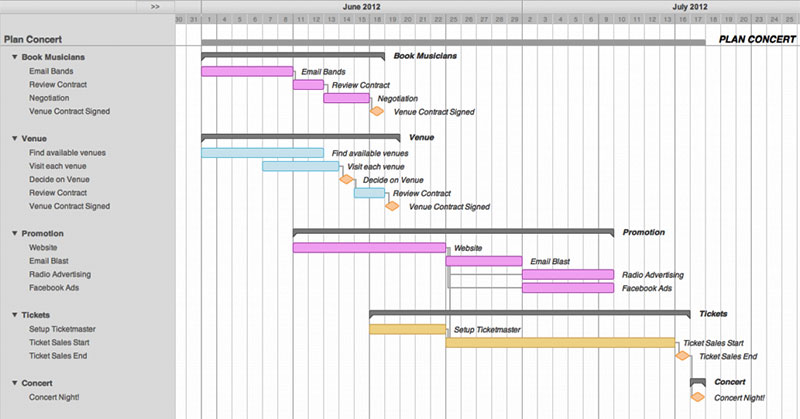
Time and task master, the Gantt chart is your guide through the project management jungle. Horizontal bars map out timelines and deadlines, making it crystal clear who’s on what and when things are due.
What to use it for:
- Managing project schedules
- Coordinating task dependencies
- Tracking progress against time
Tips for creating one:
- Update regularly for accuracy
- Use different colors for various tasks or phases
- Keep the timeline consistent and clear
What we like about it: The control it gives—there’s no project too tangled for a well-executed Gantt chart to make sense of.
Chord diagram
Chord diagrams are perfect for visualizing relationships between different entities or categories, highlighting how elements are connected.
What to use it for:
- Representing flow or relationships between categories
- Showing how elements are interconnected
- Analyzing data that involves interactions between parts
Tips for creating one:
- Use distinct, non-clashing colors to represent different relationships
- Keep the chart simple and avoid overloading with too many categories
- Label the chords clearly for better understanding
What we like about it: Chord diagrams provide a stunning way to visualize complex relationships, making connections clear and intuitive.
Network diagram
Network diagrams are types of graphs ideal for representing complex relationships between entities, showing how elements in a network are interconnected.
What to use it for:
- Mapping relationships in networks (e.g., social or organizational)
- Analyzing the structure of connected systems
- Visualizing dependencies and pathways in systems
Tips for creating one:
- Keep nodes and edges well-spaced to avoid clutter
- Label connections and nodes clearly for easy understanding
- Use colors or sizes to emphasize key relationships
What we like about it: Network diagrams turn complex networks into understandable visuals, helping to identify important connections or bottlenecks.
Connection map
Connection maps are similar to network diagrams but focus on the relationship and interactions between points, often used in social or organizational contexts.
What to use it for:
- Representing the connections between entities or points
- Mapping networks or organizational interactions
- Analyzing relationships and dependencies
Tips for creating one:
- Use clear nodes and lines to represent points and connections
- Label connections for better understanding
- Group related points together to minimize clutter
What we like about it: Connection maps provide an easy-to-understand way of visualizing relationships and interactions between entities.
Geospatial charts
Gauge charts
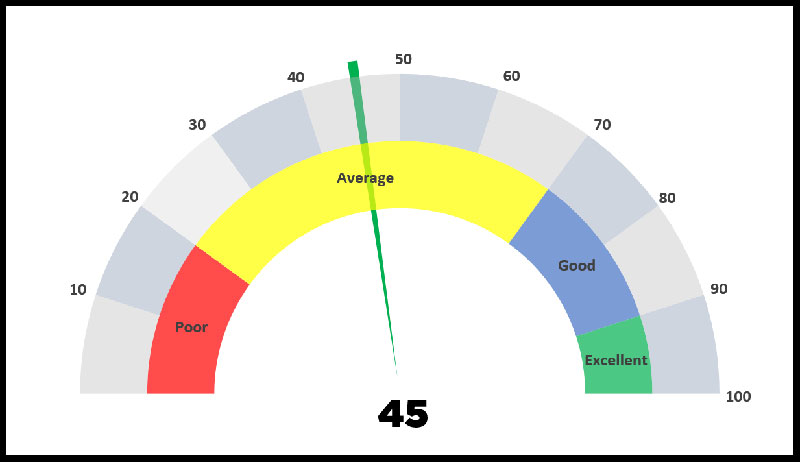
Gauge charts mimic the dials and readings on a dashboard, providing real-time status checks. They show where a value sits within predefined ranges—like your data’s personal speedometer.
What to use it for:
- Monitoring key performance indicators
- Tracking progress towards goals
- Displaying status evaluations
Tips for creating one:
- Define clear ranges or zones
- Use contrasting colors for instant comprehension
- Limit the data to a manageable single metric
What we like about it: Its immediate readability—Gauge Charts offer quick, dashboard-style assessments that drive decisions.
KPI chart
KPI charts are used to track and monitor key performance indicators, helping organizations assess how well they are achieving their goals.
What to use it for:
- Monitoring performance against targets
- Visualizing goals and progress in a simple way
- Highlighting important metrics for decision-making
Tips for creating one:
- Keep it simple and focused on key metrics
- Use clear visual indicators to show progress
- Ensure the chart is updated regularly for accurate tracking
What we like about it: KPI charts provide a snapshot of performance, helping teams stay focused on what matters most. This is especially useful when tracking employee sentiment alongside performance, where insights from eNPS software can be visualized to better understand engagement trends over time.
So, What Are the Different Types of Graphs?
We’ve seen the many different types of charts, discovering each one’s quirks and features. Like the vibrant colors in a painting, these visual tools add clarity and impact to the story your data’s dying to tell.
- If it’s a snapshot of parts to a whole you need, pie charts offer up a visual feast.
- When trends call for tracking, line graphs step up like tireless time travelers.
- Got categories? Bar graphs raise the bar, making comparisons a piece of cake.
Mix in a dash of creativity when you select your chart. It’s not just about the data – it’s about telling a tale, making those numbers stick.
Working with visualization tools? They’re like a chef’s best knives, waiving magic over rough ingredients to churn out a Michelin-star dish. But remember – know your types of graphs and when to use them – it’s what makes your data work.
Are you interested in creating awesome charts in WordPress? Then check out wpDataTables, the #1 tables and charts plugin for WordPress.
FAQ About the Types of Charts and Graphs
What’s the best chart to use for showing trends over time?
Line graphs, knock it out of the park here. They’re the classic go-to for a reason. You plot your data points along two axes and join the dots. The resulting ups and downs show trends as clear as day. Whether it’s market research numbers or tracking fitness goals, line graphs are your friend.
Can you explain when to use a pie chart?
Ah, the pie chart: ideal for displaying quantitative information that adds up to a whole. Picture your classic pizza pie. When you’re showing how big a slice each category takes, say in budget allocation or survey results, that’s when you roll out the pie chart.
Why would someone use a bar graph instead of a line graph?
Think about categories. Bar graphs are brilliant when you’re comparing different groups, like sales across different regions or quarterly performance reviews. When you’ve gotta showcase differences side-by-side, bar graphs are like visual candy bars – each category gets its own and there’s zero confusion.
What scenarios are best for using a scatter plot?
Alright, scatter plots are like matchmaking apps for data points—they show relationships. Are two variables playing nice together or not? You’re in data analysis heaven if you’re looking for correlations or trends amidst a field of seemingly random data. Like how study time relates to exam scores.
When is it more appropriate to use a histogram instead of a bar graph?
Feeling statistical? Histograms are your move. They’re about distribution—clumping data into ranges rather than isolated categories. Imagine you’ve got survey results with ages. Pop them into age groups, and a histogram will show how those groups stack up. It’s all about the range game.
What’s the main difference between a histogram and a bar graph?
Space—or the lack of it. Histograms have bars smushed together, showing continuous data—like age or weight. Bar graphs leave a little breathing room between the bars because they deal with discrete categories, like your favorite ice cream flavors or different brands of shoes.
Why use a Gantt chart?
Oh, you’re all about that project life? Gantt charts keep your tasks, deadlines, and who’s doing what straight. It’s a project manager’s dream—able to see the whole timeline at a glance. Miss a beat, and it’ll stick out like a sore thumb on a Gantt chart.
Can you use a flow chart for data representation?
No doubt. Flow charts tap into your inner guide. They’re ace for showing processes, like how a user navigates an app or the steps in a recipe. Start to end, decision points, different pathways—it’s all there in a roadmap format that’s as simple as following, well, a flow.
How do you choose which chart to implement when presenting data?
It’s about your message. What’s your data saying? What do you want to highlight? Each chart has its superpower—some for comparison, some for trends, some for distribution. Tailor your chart choice like you’d pick an outfit for the right occasion—in sync with the message and the audience.
What role does data visualization software play in chart selection?
Picture having a Swiss Army knife for data visualization. That’s your software right there. Tools like Microsoft Excel, Tableau, and Google Charts give you options galore and make the creation process smoother than a jazz record. They help you pick, customize, and perfect the chart for your data’s story.