
Ever had a mountain of survey responses staring back at you, daring you to make sense of them? Yeah, me too.
But here’s a secret: it’s easier than you thought to create charts from those Google Forms results and publish them on your website. Stick around, because by the time we finish this chat, you’ll wield the power to morph numbers and checkboxes into insight-popping visuals.
We’re diving deep how to make the most of your survey responses and create charts that tell the story – directly from Google forms. It’s like painting, but your colors are the Google form results representation from real people.
From crafting pie charts that would make a baker jealous to bar graphs that stand tall, this read is your ticket to the data visualization league.
Table of Contents
How to Create Charts from Google Forms’ Results?
Step 1: Select appropriate question types

To generate a report from the survey results, use types of questions that provide a quantifiable and consistent variation of data.
For better analysis, it is helpful to make answering possible in one of the following ways. Choose from multiple-choice, linear scale, checkbox, or a drop-down list.
Providing a set of possible answers enables faster processing of survey responses.
Using the Short Answer format yields high variability in data. This makes it harder to measure and analyze.
Step 2: Name data range
After saving the Google forms responses in a Google spreadsheet, it’s time to set the data range. Naming a range of cells makes it easier to create formulas.
The first row of the sheet shows the questions in the survey form. Each question occupies a single column.
For this step, it’s necessary to name each column. For example, if the question in the first cell of the column is “How old are you?”, then name it ‘Age’.
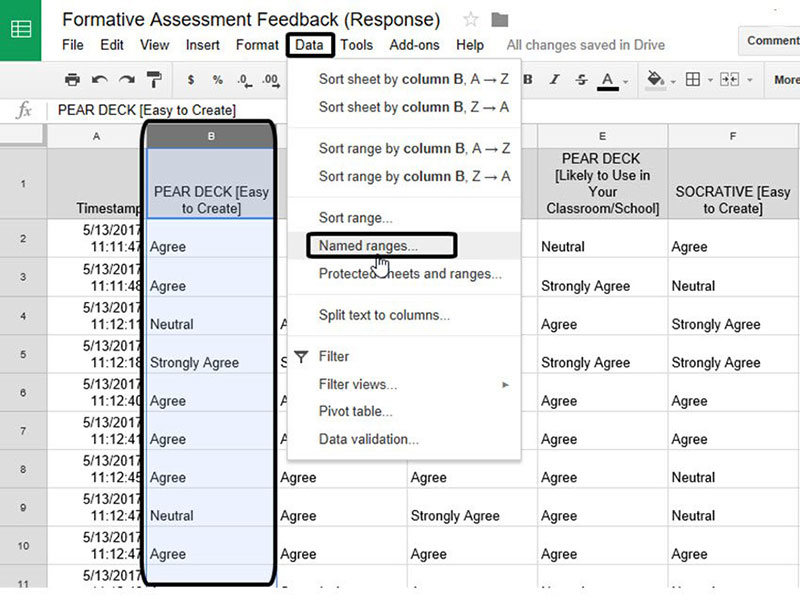
To name a range:
- Highlight the question or column to graph by clicking the letter of the column.
- On the menu bar, go to ‘Data’ then click ‘Named ranges’.
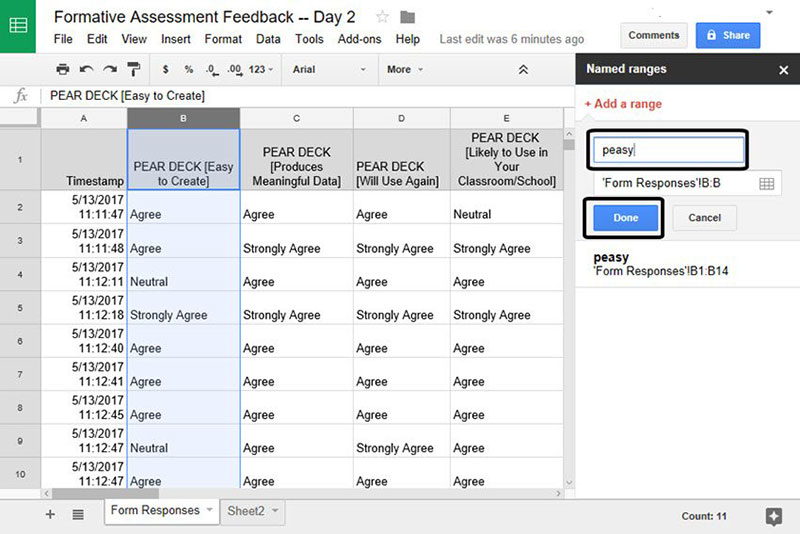
- Type in the name of the range.
- Click ‘Done’.
Remember, the name of the range can only contain alphanumeric characters and underscores. It cannot begin with a number.
It must not have any spaces or punctuations or go beyond 250 characters. The words “True” and “False” are not valid, and nor are the “A1” and “R1C1” syntax.
Step 3: List down responses in a new sheet
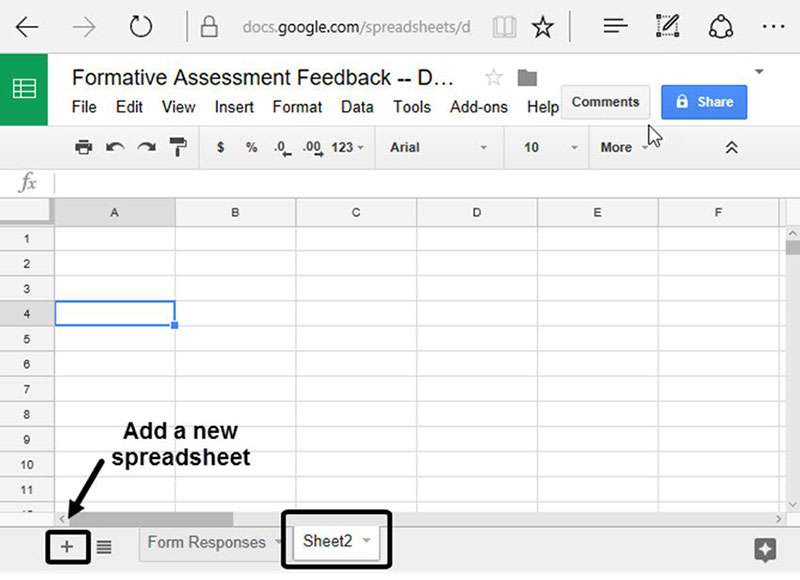
- Create a new sheet in the spreadsheet by clicking ‘Add Sheet’ or the cross icon at the bottom left corner of the sheet.
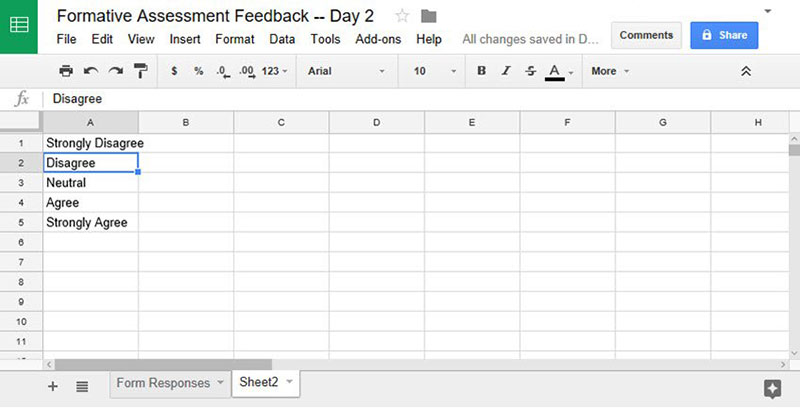
- In Column A, list down all the possible answers or Google forms responses to the question highlighted in the first step. Make sure that all the responses listed are the exact responses appearing in the Google Form.
Step 4: Use the ‘countif’ Function
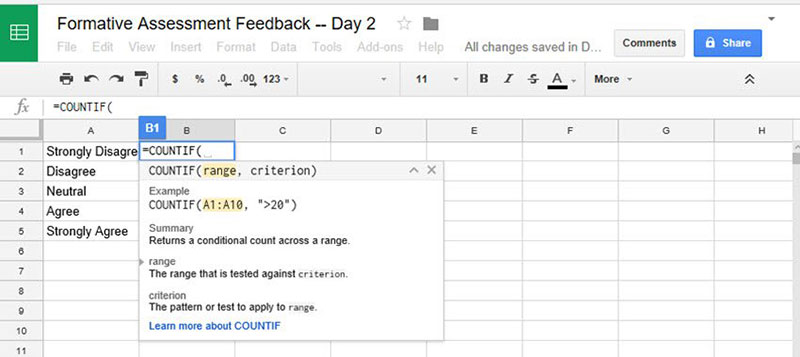
In Google Sheets, the ‘countif’ function returns a conditional count across a specific range. This means it counts how many times a certain data occurred.
This function is very useful. It will count how many respondents chose a specific response in the selected range.
The formula for ‘countif’ uses the named range for reference (from the first sheet). It also uses the cell address of the response to count (from the new sheet).
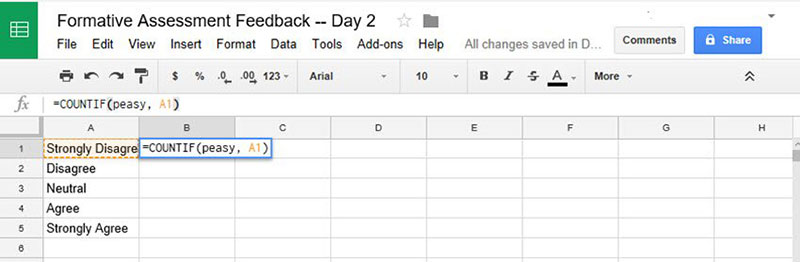
It starts with ‘=countif’ syntax. Then the named range and the cell address separated by a comma and enclosed within parentheses.
As an example, it should look something like this: =countif(Age, A1).
Insert the ‘countif formula’ in the first cell of Column B. Once entered, Google Sheets will offer to apply the formula in the following rows.
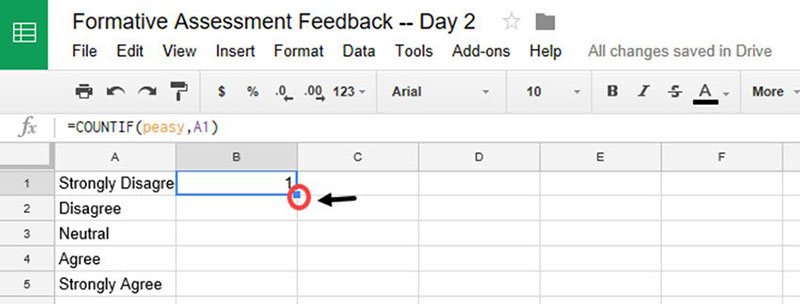
If the auto-fill option doesn’t appear:
- Select the cell that has the ‘countif’ formula.
- Hover over the tiny box at the bottom right corner of the cell. The mouse cursor should turn into a plus (+) sign.
- With the plus sign, click the bottom right corner of the cell and drag it down across the rows as needed. It will automatically fill in the cells with the ‘countif’ formula.
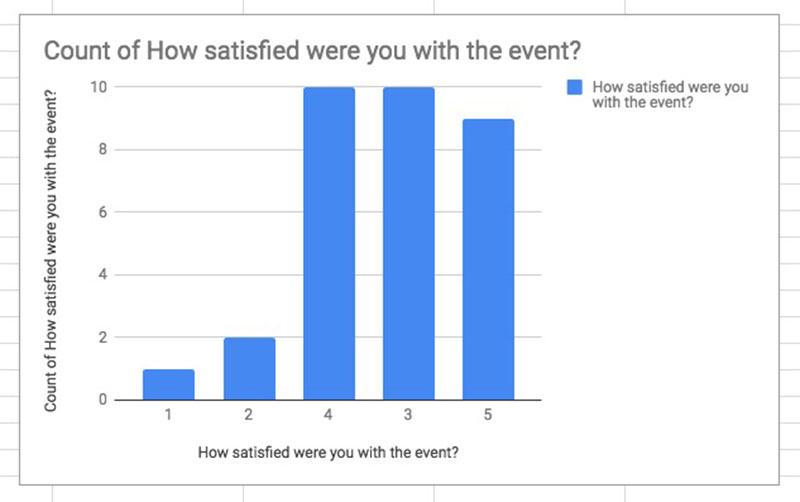
Step 5: Create a chart from Google forms’ results
After using the ‘countif’ function, there should now be a new set of data. Use this to create a Google forms results graph.
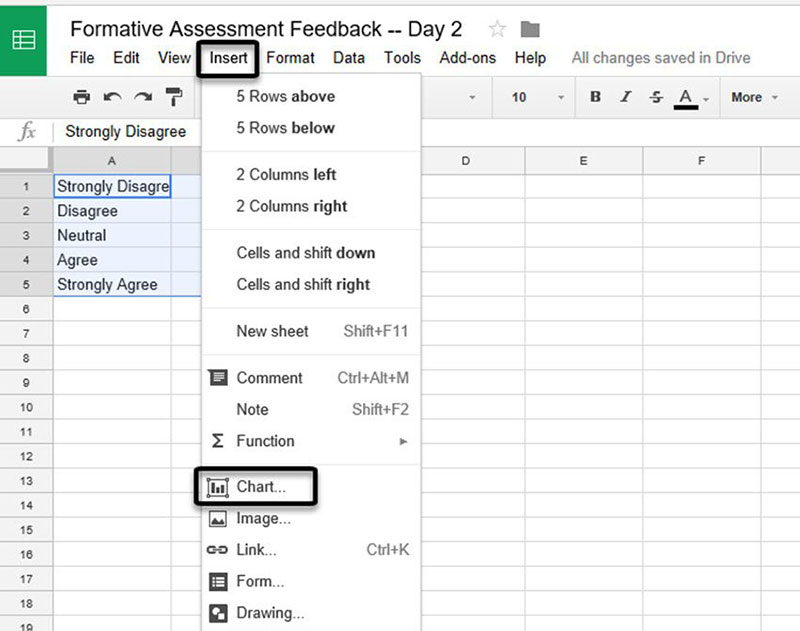
- Highlight all data in columns A and B.
- Go to the menu bar and click ‘Insert’.
- Select ‘Chart’. The ‘Chart Editor’ will appear on the right-side column.
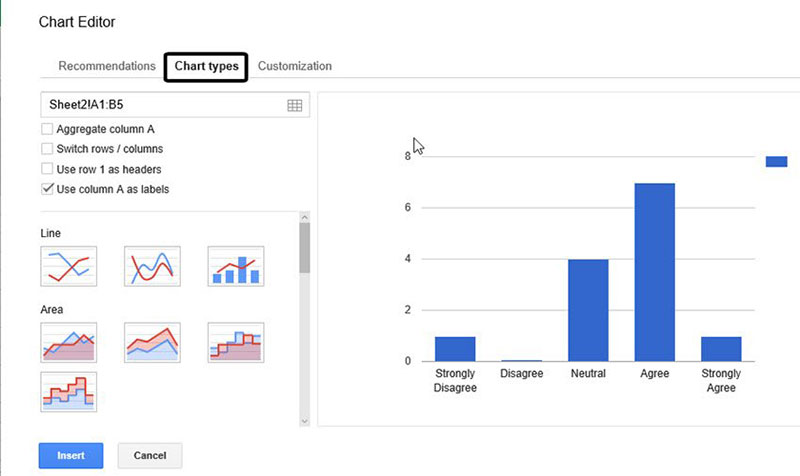
- On the ‘Setup’ tab, choose the type of chart appropriate for the data. For this example, use a column graph or pie chart.
Step 6: Customize the chart
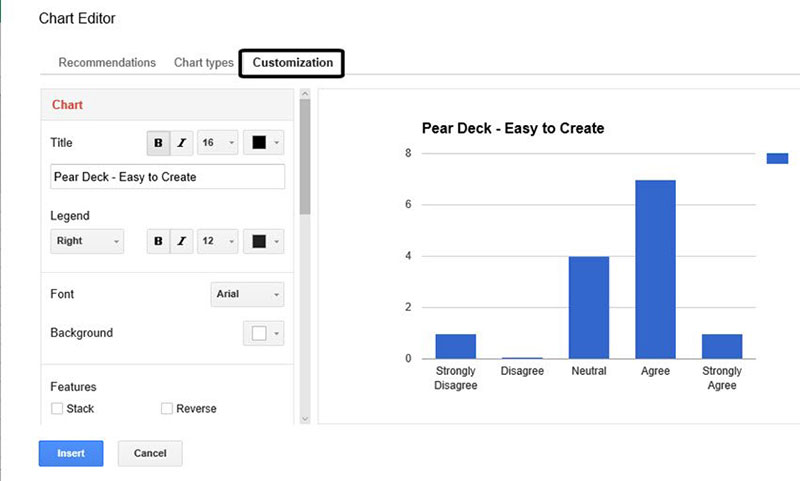
On the Chart Editor, go to the ‘Customize’ tab. One can now customize the chart style, the format for axis titles, legends, gridlines, and ticks.
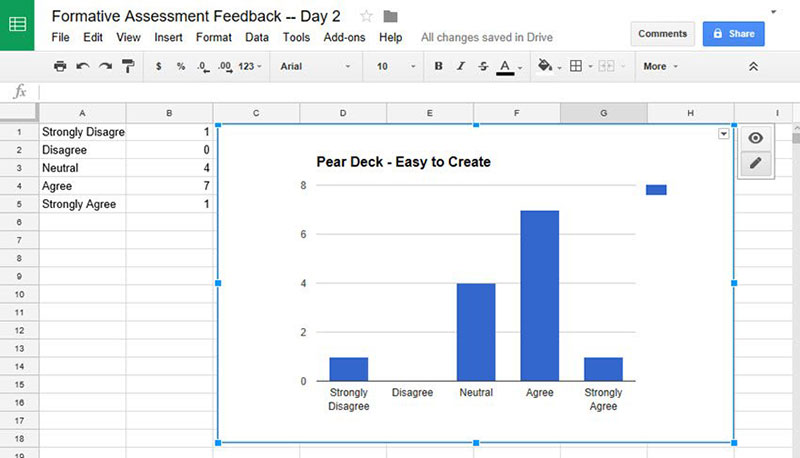
The changes will automatically display in the Google forms results graph. Users can drag the chart away from the cells with data and place it on the other area of the spreadsheet.
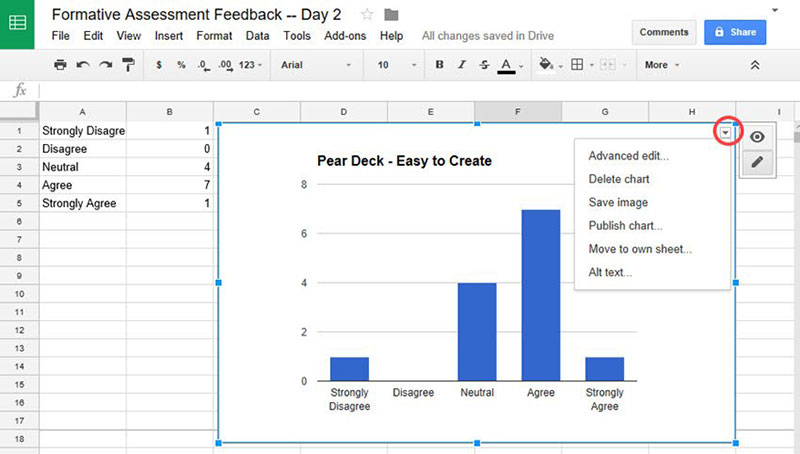
To download, copy, edit, publish or delete the chart, click the three vertical dots icon at the upper right corner of the chart. Then select the required command.
Now the Google Forms results graph is ready for report.
Free Chart Type Picker
Analyzing Form Results in Google Sheets
Google Sheets has a variety of tools for analyzing Google forms responses and other data.
It can perform simple to complex calculations using its formulas and functions. These include sum, averages, counts, and more.
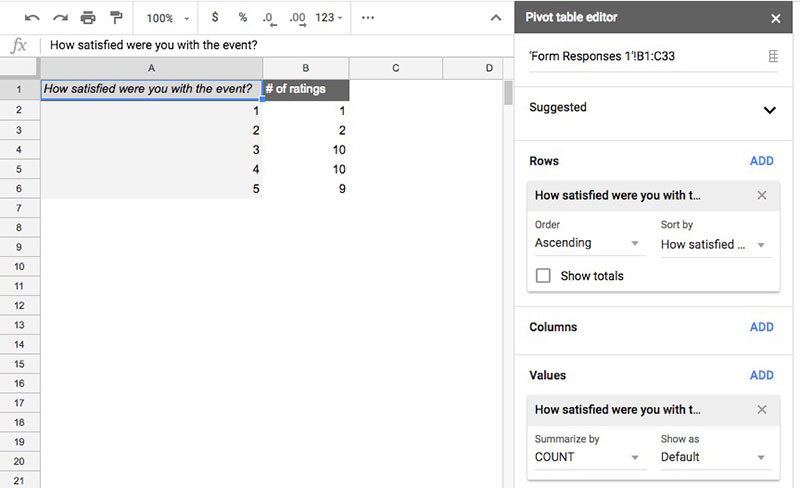
Users can also use pivot tables to summarize a bulk of Google forms responses. It provides a summary of responses and reorganizes data for easier data analysis.
To create a pivot table, click ‘Data’ on the menu bar then select ‘Pivot table’.
Google Sheets has other useful tools for generating a summary of Google forms responses. For instance, histograms and pivot charts.
To create other types of charts, go to ‘Insert’ on the menu bar then click ‘Chart’. On the Chart Editor, choose which type of chart to use.
How to Create Google Form Charts and Publish them on Your Website?
Using Forminator + wpDataTables
Using Google Forms and Google Sheets helps anyone organize surveys and analyze responses. Both make powerful statistics tools for data analysis and presentation.
There are also other web-based tools and other methods available. These Google form alternatives can also build forms and create responsive tables, charts, and graphs.
IvyForms is a WordPress form builder plugin. It provides an easy way to create different types of forms.
wpDataTables is a WordPress table plugin. It creates responsive tables and charts from Microsoft Excel, CSV, and PHP.
To create tables and charts from responses generated by IvyForms users need to install both plugins and use wpDataTables & IvyForms integration.
IvyForms and wpDataTables also make a powerful combination of tools for creating surveys and data presentations. They are easy to use, free, and completely customizable. Besides IvyForms, wpDataTables also has free addon for Forminator.
If you want to see in more detail how this works, you can check out our article on creating a survey table with Forminator and wpDataTables.
Using Google Forms and Google Sheets helps anyone organize surveys and analyze responses. Both make powerful statistics tools for data analysis and presentation.

How to Create Google Forms Pie Chart with wpDataTables?
Step 1: Export Google Forms responses
- Open your Google Form – click on Responses – View responses in Google Sheets.
- In Google Sheets, you now have all your survey data in a structured table.
Step 2: Prepare the data
- Make sure each question/column is clearly labeled.
- For a pie chart, you’ll typically want categorical data (e.g., “Favorite color,” “Yes/No answers”)
Step 3: Create a new table in wpDataTables
- Go to your WordPress dashboard – wpDataTables – Create a Table.
- Choose Create a table linked to an existing data source – select your Google Sheet CSV export or upload the CSV.
- wpDataTables will automatically generate a table from your data.
Step 4: Generate the pie chart
- In wpDataTables, click on Create a Chart linked to a Table.
- Choose Pie Chart as the chart type.
- Select the table you just created as the data source.
- Assign labels (categories) and values (counts or sums) for the chart.
- Customize colors, labels, and legend as needed.
Step 5: Embed the pie chart
- Copy the generated shortcode from wpDataTables.
- Paste it into any WordPress post or page where you want the chart to appear.
- Your pie chart is now live and dynamic – updating the table automatically updates the chart.
How to Create Google Forms Bar Chart with wpDataTables?
Step 1: Export Google Forms responses
- Same as above: open your Form – Responses – Google Sheets – export or use CSV.
Step 2: Prepare the data
- Identify which column you want to measure (numerical or categorical counts).
- Bar charts work best with aggregated values.
Step 3: Create a new table in wpDataTables
- Create Table – Upload CSV / Link to Google Sheet.
- Ensure columns are named correctly and data types are recognized (number, string, date).
Step 4: Generate the bar chart
- Click Create Chart linked to a Table – select Bar Chart.
- Assign X-axis (categories) and Y-axis (values).
- Customize chart settings: stacked bars, orientation, colors, labels.
Step 5: Embed the bar chart
- Copy the shortcode generated by wpDataTables.
- Paste it into your WordPress page or post.
- Any updates in the table (manual or via Google Sheet import) reflect automatically in the chart.
FAQ on How to Create Results Charts from Google Forms
How do I start creating graphs from Google Forms data?
Well, first up, you’ve got to have some responses on your form, right? Once you’ve got those, head over to the ‘Responses’ tab in Google Forms. You’ll see a summary with auto-generated graphs. For more control, click that green icon to hop into Google Sheets for some graphing action.
Can I customize the types of graphs generated from responses?
Absolutely, you bet. In Google Sheets, click on your data and look for the ‘Chart’ icon. From there, sky’s the limit. Choose from bar graphs to pie charts and even line graphs. Tweak them until they’re telling your data’s story in the clearest way possible.
What’s the deal with integrating Google Forms with Google Sheets?
It’s pretty cool, actually. When you’re in Google Forms, just click on that green Sheets icon, and boom – it zaps your data straight into a new sheet. This is where the magic happens. All your data, neatly organized and ripe for turning into insightful visual data presentations.
How can I share my Google Forms results graphs?
Sharing is caring, right? If you want to share your Google Forms results’ graphs on your website, wpDataTables is the answer.
Is it possible to analyze multiple-choice questions using graphs?
For sure, multiple-choice questions are basically asking to be graphed. They’re awesome for quick data visualization. Each option gets its own slice of the pie in a pie chart or its own bar in a, well, bar graph. Patterns will pop out, and you’ll see what’s trending in no time.
How do I display open-ended responses in a graph?
That’s a bit tricker, but here’s the scoop. You might want to look into creating a word cloud for high-level vibes or tally up common phrases for a bar graph. Honestly, it’s more about spotting trends and presenting them in a data visualization tool like a word frequency chart.
Can I create a graph comparing responses over time?
Oh, we’re getting fancy – and yes, you can. As you collect responses, you can plot them out on a line chart within Google Sheets. This way, you can track how responses evolve, bump up, and dip down. Time becomes your secret ingredient in the data storytelling mix.
What are some tips for making my Google Forms results graphs look professional?
Key things to keep clean – stick to a color scheme that isn’t a rainbow explosion, keep fonts readable, and don’t go overboard with gridlines. Remember, simplicity is your ally—let your data do the talking without the flamboyant accessories.
How can I ensure my graphs accurately represent my Google Forms data?
Data integrity, important stuff. Double-check that your ranges are correct when you set up the chart. Ensure that you’re not mixing apples with spaceships, and keep an eye on the scales on your axes – they should make sense for the range of data you have.
What should I do if I have too much data to display in a single graph?
Don’t cram it! If you’ve got loads of data, think about making a series of graphs or even a dashboard. Group related pieces together, create individual charts for different question sets, and give your viewers a chance to digest each bit. It’s like a tapas bar – small plates, big flavors.
Conclusion
We’ve now covered the essentials of how to create a Google Forms results graph and turn raw responses into clear, useful insights. Visualizing data with pie charts, bar graphs, or line charts makes it much easier to understand patterns and share results effectively.
Key things to keep in mind:
- Keep your visuals clean
- Stay accurate to your data
- Present results with clarity
You now have practical ways to make your Google Forms results more meaningful.
If you’d like to go further, you can explore how to embed a chart on your website, compare different survey graph makers, or dive into guides on survey chart types and survey tables.
For more advanced visualization, check out tutorials on Chart.js examples, practical tips for chart designs, or comparisons of types of charts and Highcharts alternatives. And if you’re working in WordPress, our resources on WordPress charts will help you present data on your site without writing a line of code.


