Weather data is almost everywhere. It appears on the side of the television shows, websites, and in your smartphone’s widget. It is possibly one of the most frequently used time-series data to include in dedicated TV channels.
The weather data visualization tool aims to get the forecaster’s knowledge and expertise to the current numerical weather forecast model. As a result, the knowledge and data will give all the available weather information to users. By combining charts, graphs, and responsive tables in your weather articles, readers can spot patterns far more easily.
This article explores different tools to visualize the latest weather statistical data.
Weather Data Visualization Tools
SmartMet
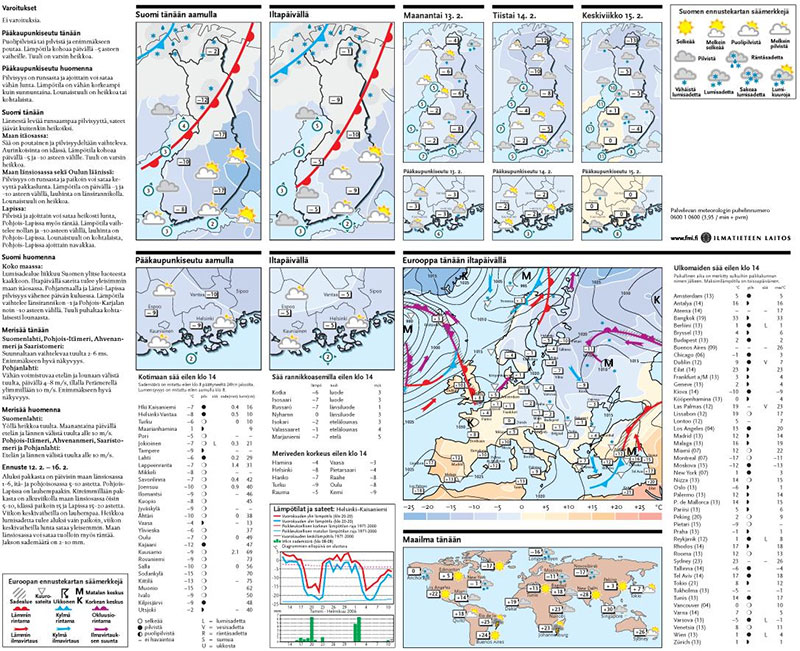
The forecaster can make new updates to the numerical weather model output through this weather data visualization tool. They will base it on the meteorologist’s expertise and the available observation.
The SmartMet’s editor ensures that all the edited data, weather forecasts, and products have the best quality.
Core Features
- Allows the users to improve or change the model data, instead of using it as a viewing tool for only the meteorological data
- SmartMet creates better or improved data out of the layer to layer and/or parameter to parameter that serves as the grid formatted information.
- It enables the users to create tailor-made weather forecasts that cater to unlimited numbers of viewers.
- Using SmartMet is economical and efficient.
- It comes with an improved grid-files edited by the SmartMet’s editor.
wpDataTables
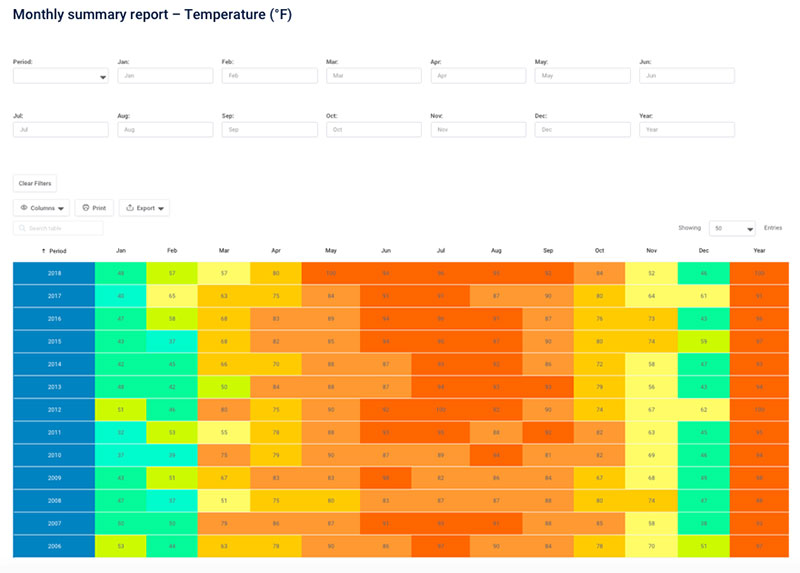
This is a premium plugin that helps users to collect data and visualize the current weather and climate.
It allows them to create and customize charts, graphs, and responsive tables. The import of Excel files or CSV data is one of the most practical ways to display large weather datasets on your website.
Core Features
- It allows users to customize or create a monthly summary report table.
- The wpDataTables plugin enables the import of Excel, MySQL query, Serialized PHP Array, JSON, XML, Google Doc, and CSV.
- It gives options to create a new table, generates a custom query using a GUI or graphical user interface tool, and links to a live data source.
- It doesn’t require coding or complicated configurations while giving users the capability to have unlimited customizations.
Unidata
This Unidata’s Integrated Data Viewer is a 3D geoscience visualization users’ tool. It helps them to view and analyze the weather data in an integrated way. It complies with and combines together with the standard scientific data servers, which include Unidata’s TDS.
Core Features:
- It enables the users to view and scrutinize the surface observations (METARs), satellite imagery, and the gridded data–specifically numerical weather prediction model output.
- Unidata allows access to a variety of real-time and archive datasets.
- Through the Unidata weather data visualization tool, users can now share their data holding and analysis products with other users.
MeteoInfo
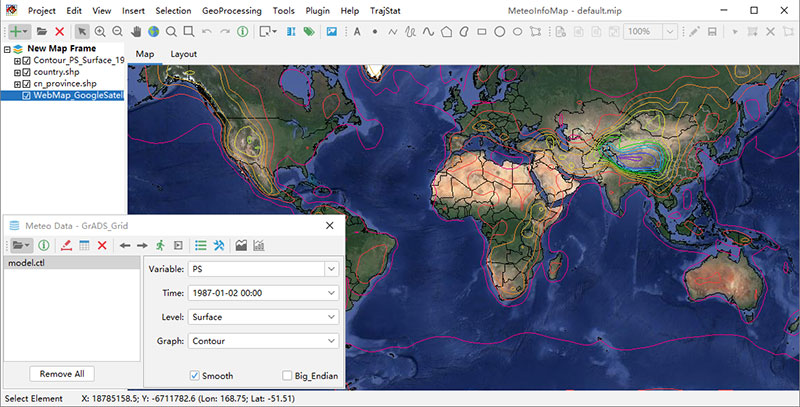
The goal of this software tool’s creator is to provide meteorological data visualization and analysis. It has the essential features to provide the data needed to show the latest update regarding the weather.
Core Features
- MeteoInfo comes with various essential GIS function support that can view or read widely-used meteorological data formats, like GRIB and NetCDF.
- It has a .NET class library provided for desktop applications for end-users and software developers.
- MeteoInfo provides data models for complex meteorological grid and station data analyses.
- The MeteoInfo’s class library is ideal for developing software routines and manipulating the meteorological data and spatial.
- Users can run MeteoInfo instantly through the IronPython language scripting.
- The MeteoInfo desktop application comes with a user-friendly GUI that serves as a powerful tool to view and study the meteorological data sets.
Panoply
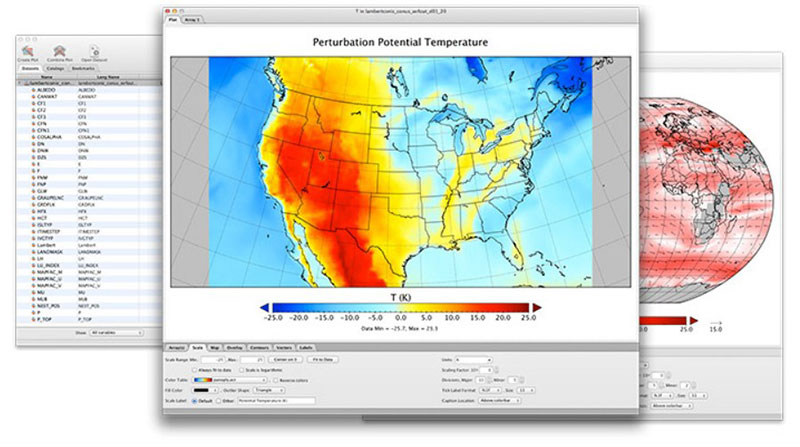
This weather data visualization tool is a cross-platform application that is applicable or compatible with Linux, Windows, Macintosh, and other desktop computers. It currently plots geo-referenced and different arrays from GRIB, HDF, netCDF to other datasets.
Core Features
- Keep plots to disk PNG, JPEG, GIF, TIFF bitmap images, PostScript graphics files, or PDF.
- It enables the users to apply a customized ACT, CPT, RGB color table, or scale color bar through numerous color tables.
- This Panoply tool overlays continent outlines.
- It creates a zonal average line plot or plot Ion-lat data on a global or regional map through more than 100 map projections.
- Panoply allows the use of averaging, summing, and differencing to combine two geo-referenced arrays.
- It enables the users to slide 1D arrays more significant multidimensional variables to make it possible to create line plots.
- From more extensive multidimensional variables, it allows the slice and plot “generic” 2D arrays.
- Users can slice and plot geo-referenced latitude-longitude, longitude-vertical, latitude-vertical, time-vertical arrays, and time-latitude from significant multidimensional variables.
Climate Explorer
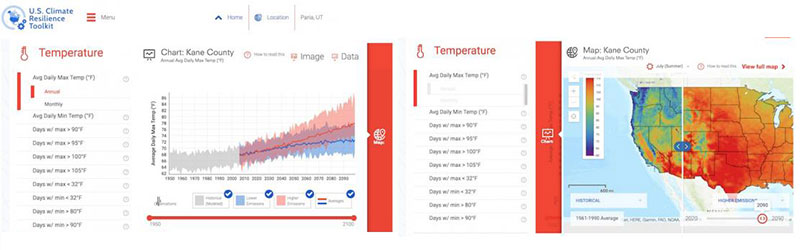
The Climate Explorer is a sought-after weather data visualization tool. It showcases and presents the weather statistics through graphs, maps, and data downloads. Also, before they offer data, they run an analysis or observation toward the climate variables in every country of the United States.
This Climate Explorer tool projected conditions for two possible futures.
These Possible Futures Are:
- The human emissions of heat-trapping gases increase rapidly through to 2100.
- Humans try to reduce global emissions of heat-trapping gases.
The eight different climate variable observed and projected by maps:
- Cooling Degree Days
- Heating Degree Days
- Days of Precipitation Above 1 Inch
- Mean Daily Precipitation
- Precipitation
- Days with Min Below 32-degree Fahrenheit
- Days with Max Above 95-degree Fahrenheit
- Mean Daily Minimum Temperature
- Mean Daily Maximum Temperature
To access graphs and maps for countries and county-equivalents in the contiguous United States, users should enter the zip code, country, and city.
Climate Reanalyzer
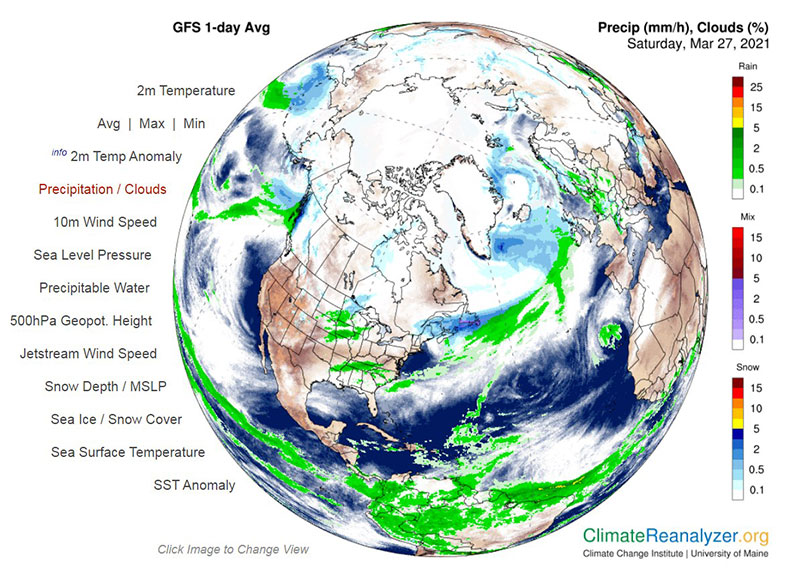
Dr. Sean Birkel is the one who created this weather data visualization tool. This Climate Reanalyzer is responsible for visualizing climate and weather datasets. The Climate Change Institute at the University of Maine supported this platform.
This tool became possible through Corner Family Foundation’s funding, Russell Grinnell Memorial Trust, and National Science Foundation.
Core Features
- Climate Reanalyzer gives access to climate information to the users through reanalysis and historical station data.
- The users can plot the correlation analysis, time-series, and maps specifically for gridded models.
- This tool enables the users to access the datasets and models that are available to the public.
- Climate Reanalyzer comes with the model time-series and station data to export them in a CSV format to use in spreadsheet software.
Visual Weather
This is a choice for monitoring incoming messages and values, producing textual (TAFs, public forecasts), graphical products (surface analysis, SWL, and more), and software for graphical reception representation of meteorological data.
Core Features
- Visual Weather is a very popular meteorological software that manages the forecast roles and workflows.
- It comes with an automatic generation of image products and the tools needed for accomplishing the tasks related to meteorological service.
- Visual weather is a weather data visualization tool that offers a scalable architecture that will positively impact the service.
- It runs on several systems, like Windows and Linux.
- This tool integrates all the data types from a wide range of connections to its data sources.
Surfer
Surfer has the essential features and functionalities to present accurate weather data to the users. It provides tools to create high-quality maps for construction, hydrology, geology, and any related industry. This tool delivers your message to the stakeholders, clients, and coworkers.
The users only need to wait for a short time to visualize the current weather data. Surfer gives access to worldwide aerial imagery, terrain data, worldwide vector data, and Open Street Map imagery.
Core Features
- Surfers allow users to access the surplus of online data by including a custom link to the source. This is beneficial to individuals with favorite data servers.
- Users can gain in-depth knowledge about the data viewed in three-dimensional space–whether it is for research, industrial projects, or education.
- It enables the users to switch between the Surfer’s 2D and 3D perspectives to discover the trends and data patterns.
- Its 3D viewer enables all aspects of data to be easily understood, modeled, and analyzed.
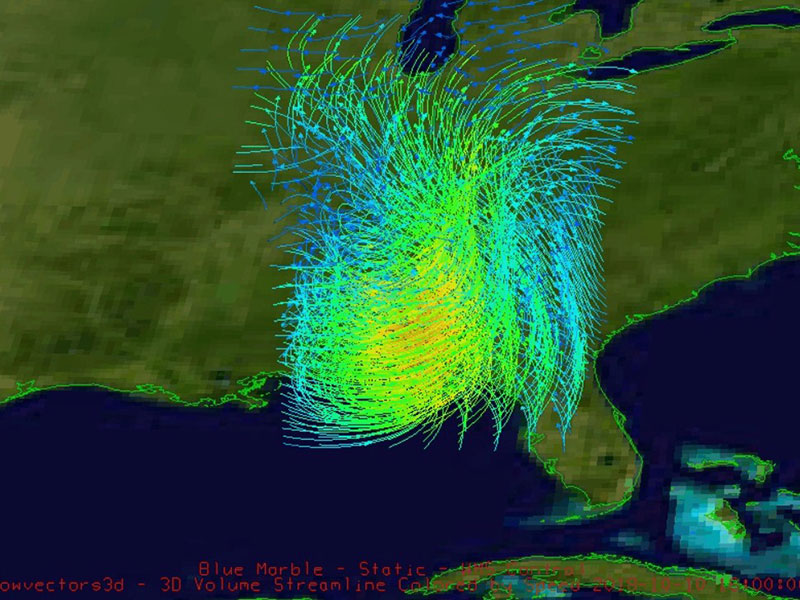
NOAA’s Weather and Climate Toolkit
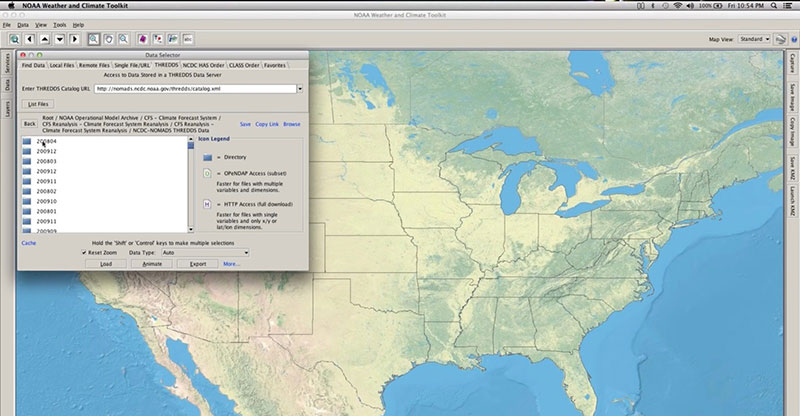
This weather data visualization tool is ideal for individuals who want to have free and platform-independent software. It is for more advanced users who know how to use the platform for collecting and presenting weather data.
Core Features
- This tool allows access to the weather or climate web services given by the NCDC and other organizations.
- It enables the users to visualize the climate data and weather data export, including Model data, Satellite, and Radar.
- It comes with basic filtering, animations, and background map tools.
- NOAA’s Weather and Climate Toolkit allows the users to export images and movies in various formats, like Gridded NetCDF, ESRI Grid, GeoTIFF, Well-Known Text, Shapefile, and KMZ.
- Its advanced data export feature has support for Google Earth, allowing the 3-D and 2-D export of rendered isosurfaces and data.
If you liked this article about weather data visualization, you should check out this article about open source data visualization.
There are also similar articles discussing data visualization javascript libraries, WordPress data visualization, interactive data visualization, and misleading data visualization examples.
And let’s not forget about articles on data visualization tools, data visualization color palettes, data visualization best practices, and data visualization examples.