

The Best AI Plugins for WordPress (2026)



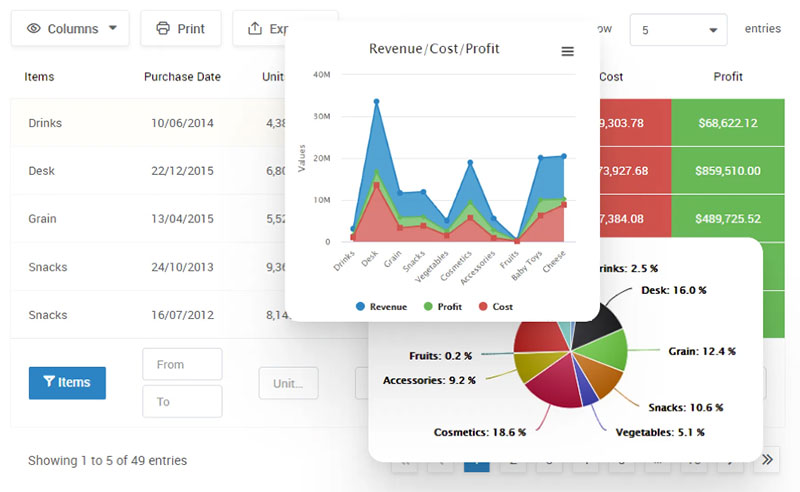
A comparison chart maker takes data sitting in a spreadsheet, a CSV file, or a database and turns it into something a reader can actually scan, a sortable table or a side-by-side chart, without anyone touching code. That’s different from…
Turning a spreadsheet or a database into something a visitor can actually poke at, hover over, filter, zoom into, is what separates an interactive chart tool from a plain image dropped into a page. That’s the category in one sentence,…
Forty responses land in a spreadsheet and just sit there. Rows and columns, no shape to any of it yet. A survey graph maker takes that raw pile of poll, quiz, or form answers and turns it into something a…