
Visual storytelling transforms raw data into a vivid experience. Imagine crafting narratives that leap off the screen, guiding your audience through a journey of discovery with each interactive element. In the digital realm, our tools are our magic wands, empowering us to create visual symphonies from numbers and facts.
Today, the art of data visualization stands as a cornerstone to clarity, an absolute in this chaotic ocean of information.
Engaging with the right tools for creating interactive charts elevates our ability to not just present data but to communicate it, resonating with viewers on a visceral level.
This dive into the world of data visualization software and interactive graphing tools will arm you with the essentials. By the close, you’ll wield the know-how to select perfect instruments from the realms of wpDataTables, D3.js, Highcharts, and beyond.
Expect to unravel treasures like drag and drop chart editors and real-time data plotting – diamonds that will shape data into stunning narratives.
Table of Contents
Tools For Creating Interactive Charts
| Tool for Creating Interactive Charts | Pricing Model | Ease of Use | Customization | Integration & Sharing Options |
|---|---|---|---|---|
| wpDataTables | Free basic plan, Premium plans | Easy | High | WordPress, Excel, Google Sheets, MySQL, others |
| Tableau (and Tableau Public) | Free (Public), subscription (Tableau) | Advanced | Very high | Numerous, including Salesforce, SQL, SharePoint |
| Vizzlo | Free basic plan, Premium plans | Easy | Moderate | PowerPoint, Google Slides, web embeds |
| Flourish | Free public version, Private licenses | Easy to Moderate | High | Embed codes, export options, custom branding |
| Visual.ly | Custom pricing for services | Easy | Dependent on service | Mainly through Visual.ly platform |
| Google Charts | Completely free | Easy to Moderate | High | Web embedding through HTML |
| Datawrapper | Free basic tier, subscriptions for added features | Easy | High | Embed codes, export options |
| Canva | Free basic use, Pro subscriptions | Very easy | Moderate to high | Social media, downloads, website embedding |
| ChartBlocks | Free limited plan, subscription for more features | Moderate | Moderate | Embed codes, social sharing, API access |
| Piktochart | Free basic plan, paid plans for more features | Easy | Moderate to high | Embed codes, social media, downloads |
| Infogram | Free to use, paid plans for advanced features | Easy | High | Embedding, sharing through URL, download as image/PDF |
wpDataTables

Interactive charts are a game-changer. They draw attention, they engage, and they make complex data digestible. But building them, it can feel like learning a new language, right?
Enter wpDataTables.
This isn’t about just creating a chart. It’s about creating your vision without the need for a PhD in coding. It’s the freedom to bring your data to life – effortlessly.
Think about this. You’ve got data, important data. It sits there on your site, static, hoping to be noticed. But imagine transforming that same data into an interactive experience. A chart that’s more than just numbers. It’s an invitation, a conversation.
That’s powerful. That’s engagement. That’s wpDataTables.
With wpDataTables, you won’t spend hours wrestling with complex codes. It’s user-friendly, intuitive, and best of all, it gets the job done right – first time, every time.
It’s not about charts anymore. It’s about interactivity. It’s about making your website a destination, not a pit-stop.
And guess what? wpDataTables is ready for you, right now. All you need to do is reach out and grasp this game-changing tool.
So, are you ready to bring your data to life?
Say yes to wpDataTables – because your data deserves to be more than just numbers. It deserves to be interactive.
Tableau (and Tableau Public)

Tableau is a platform for data visualization and analysis. It has powerful features and comes in desktop, server, online, and free public versions. It can import hundreds of data types, including CSV files from Google Ads or Salesforce.
Users can create charts and graphs that provide insight. Its mapping capabilities allow designers to create better location-based data visualizations.
Tableau Public is a free software version that allows anyone, including journalists, students, and political campaigners, to create dynamic visualizations with personal data or external datasets. It eliminates the need for coding skills and removes the hassle associated with code-based visualizations, making it accessible to everyone.
Vizzlo
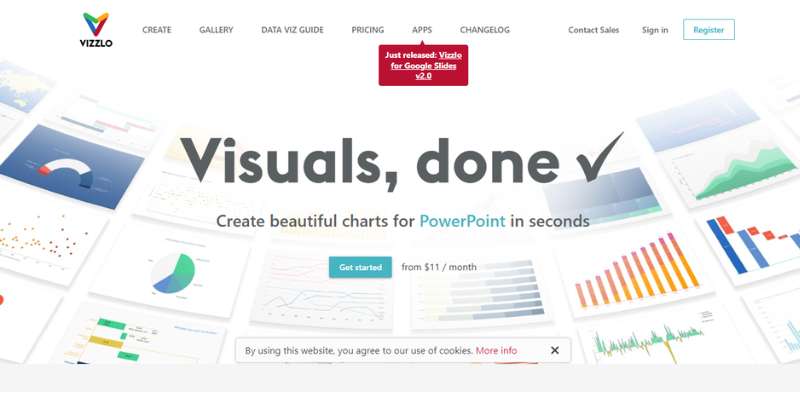
Vizzlo, a leading platform for data visualization, offers a comprehensive range of interactive features to transform your Excel chart into something impactful. With its intuitive interface and diverse chart options, Vizzlo makes creating stunning visualizations straightforward.
You can choose from various chart types, including a bar chart, line chart, pie chart, and pivot chart to showcase your data effectively. Vizzlo’s extensive customization options allow you to personalize every aspect of your charts, from colors and fonts to labels and legends.
Collaboration is also easy with Vizzlo’s real-time editing and sharing capabilities. It allows all members of your team to share their work and feedback. Whether you need to present your charts online or export them offline, Vizzlo provides versatile options to suit your needs.
Flourish

Flourish, an innovative platform for interactive charts, offers a wealth of features to transform your data into engaging visualizations. With its user-friendly interface and powerful capabilities, Flourish empowers users to create stunning charts without coding knowledge.
Simply click on “format control” to choose from various chart types to effectively represent your data. Options include bar graphs, line charts, scatter plots, and more. Flourish’s intuitive customization options also allow you to personalize your chart colors, fonts, labels, and animations, ensuring your charts align with your unique brand and style.
Collaboration is seamless with Flourish’s real-time editing and sharing capabilities, enabling teams to work together effortlessly. You can embed interactive charts directly into websites or export them as high-quality images or interactive web-based experiences.
Visual.ly

Visual.ly is an online community that connects creative professionals, including designers and illustrators, who specialize in creating visual representations of data.
As an online tool, it is great for creating interactive maps, charts, and graphs. It enables users to quickly create visualizations of their data that can be easily shared across multiple platforms. With the intuitive drag-and-drop interface, users can design custom visuals with minimal effort. Visual.ly also has an extensive library of templates that users can select to customize their work further.
The advantages of using Visual.ly are that you can contact professional designers to create custom visualizations that meet your specific requirements.
Google Charts
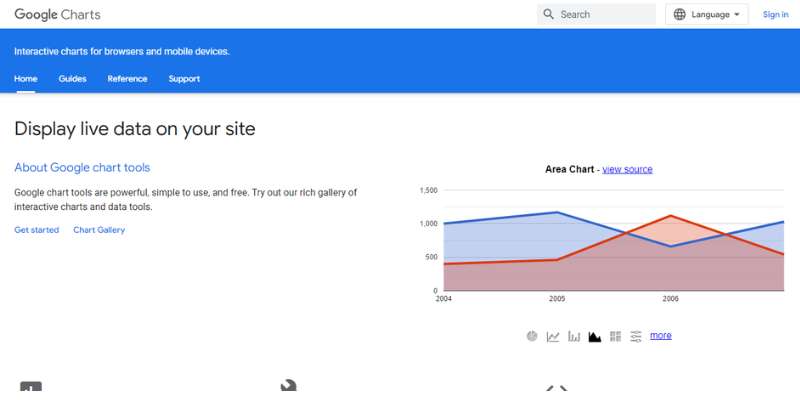
Google Charts is a fantastic and easy-to-use tool for creating custom data visualizations. It offers a vast selection of chart types that can be customized in any way. The tool boasts advanced features such as cross-browser compatibility and support for Android and iOS devices, without needing additional plugins or software.
The Chart Gallery offered by Google Charts is an incredible feature, leveraging ready-to-use charts and allowing users to quickly modify them to whatever suits their needs. Users can easily build and customize charts, from simple interactive line charts, to advanced 3D simulation models via simple CSS editing.
Google Charts can be a useful choice for designers who have some coding experience and are seeking a powerful, cost-free solution.
Datawrapper
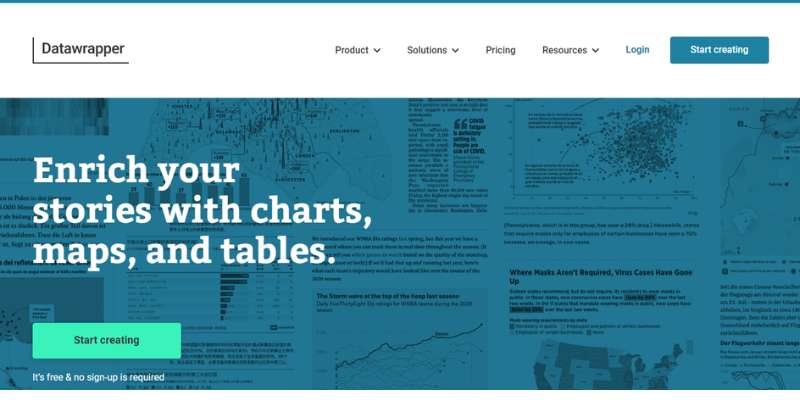
Datawrapper is another powerful tool that makes creating interactive visuals for webpages a breeze. It allows non-designers to quickly and easily create charts, tables, graphs, and more without software or design skills.
With Datawrapper, you can access data from any source—simply copy from the web or upload CSV/XLS files. This makes it perfect for visualizing live, ever-evolving data sets; you can even link to any URL or Google Sheet for automatic updates. The simple editing interface helps users customize charts with various formatting options, allowing them to convey better insights from the data they present.
Who would enjoy using Datawrapper? Typically a blogger, content writer, or journalist. But, in general it works for anyone looking to add visuals to their website or blog posts.
Canva

Canva’s interactive charts are a powerful tool that can help you tell your data story in a more appealing and informative way. With Canva’s Document Maker feature, you can create interactive charts that allow your audience to explore your data at their own pace. You can also add annotations, filters, and other interactive elements to your charts to make them more engaging.
Whether you’re a professional or a novice, Canva’s drag-and-drop functionality allows effortless customization to match your unique style and brand. Choose from bar graphs, pie charts, and line graphs, input your data, and generate dynamic visualizations.
However, in comparison with other online tools, Canva is limited in what it can do.
ChartBlocks
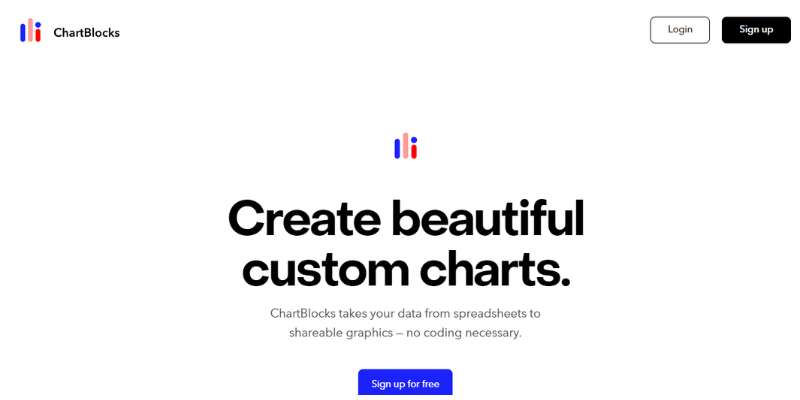
ChartBlocks is a powerful data visualization tool claiming that you can import sample data virtually anywhere. The app allows considerable customization for your final chart, with an easy-to-use chart-building wizard to help you pick the correct data. The output works on almost any device and is responsive, meaning it’s ideal if you want to embed charts into websites or rich media content.
The free version of ChartBlocks provides basic features while allowing anyone to create data visualizations. For more serious users, reasonably priced paid plans are available with additional features; this layered mesh of pricing makes the app attractive to everyone, from hobbyists to professionals.
ChartBlocks is an excellent choice if you’re looking for an easy way to bring your data to life and show it off in new ways.
Piktochart

Piktochart is a powerful data visualization tool that allows you to create stunning and informative infographics, presentations, and reports. With Piktochart, you can easily drag and drop elements to create your designs or choose from a library of premade templates.
Piktochart also offers a variety of features to help you customize your designs, including fonts, colors, and icons. Once you finish creating your design, you can share it online or download it as a PDF.
If you’re looking for a powerful data visualization tool that’s easy to use, Piktochart is a great option. Piktochart offers different of features and benefits to help you create stunning and informative infographics, presentations, and reports.
Infogram
Infogram is a great visual resource for anyone looking to present data in an attractive, informative, and engaging way. It comes with a fully-featured drag-and-drop interface, allowing even non-designers to create compelling data visualizations for marketing reports, infographics, social media posts, maps, dashboards, and more.
You can quickly and easily export your creations into several formats, including PNG, JPG, GIF , and PDF, or as HTML code. For those who require interaction with their data visualizations, Infogram also supports interactive visuals, which are perfect for embedding into apps or websites. WordPress users can use the free WordPress plugin Infogram offers to embed their visuals into their sites easily.
Another pro is Infogram provides animation to set objects to zoom, bounce, flip, fade, and slide.
FAQ on Creating Interactive Charts
Which tool is best for creating interactive charts without coding?
wpDataTables is the one to use if your site is on WordPress. You feed it numbers and it gives back a visual feast. It’s like a cheat code for those of us who break out in hives at the sight of code.
Can I integrate live data into my interactive charts?
Live data, you say? Absolutely. Plotly and D3.js are wizards in this domain. They pull fresh data straight into your charts, making them dance to the real-time rhythm effortlessly. Like watching the heartbeat of your data.
How do I make my charts mobile-responsive?
It’s the era of scrolling on the go. Bootstrap combined with Chart.js has you sorted. They’re like the dynamic duo, ensuring your charts flex and flow on devices, from the tiniest phones to the widest screens.
Are there free tools for creating interactive charts?
Freebies? Oh yes. Google Charts is your loyal ally. Solid, reliable, and doesn’t cost a dime. It’s ready to craft those visuals without reaching for your wallet.
Can I customize the style of my interactive charts?
Custom styles are a walk in the park with tools like Highcharts. Colors, fonts, sizes – you name it. It’s like giving your chart a personal stylist; a makeover for data that truly represents your vibe.
How can I add interactive charts to my website?
Adding these gems to your site couldn’t be smoother. Exporting as JavaScript widgets or embedding through an iframe – most tools offer one-click wonders that slot your shiny new charts right into your web pages.
What’s the difference between static and interactive charts?
Static charts are like old paintings – beautiful but still. Interactive charts? They invite you to a dance, letting viewers hover, click, zoom, and probe. It turns spectators into participants.
How secure are tools for creating interactive charts with sensitive data?
Top-tier tools come with the fort Knox treatment. Look for options with robust privacy settings, especially those offering local processing, like Tableau Public. Your data’s kept under lock and key.
What are the best practices for designing interactive charts?
Best practices? Keep it simple, intuitive, and insightful. It’s not just about pretty colors; UX/UI design principles reign supreme. Your chart should guide the viewer through the story, offering revelations without overwhelming them.
How do I choose the right type of chart for my data?
Match the story to the chart. Ponder on what you’re telling. Comparisons scream for bar charts; trends adore line graphs. Tools like Microsoft Excel and Power BI suggest chart types based on your data – a helping hand in making that perfect match.
Conclusion
So there we have it. We’ve journeyed through the intricate tapestry of tools for creating interactive charts, each thread weaving its own unique narrative through data.
- We edified ourselves on the power of visualization APIs.
- We discovered the might of real-time data plotting.
- We even marveled at the elegance of drag and drop chart editors.
As we part ways, remember: these tools aren’t just instruments; they’re partners in your quest to elevate facts into tales, numbers into experiences. Embrace them, and let the charts be not just seen but felt, melding seamlessly with the story you yearn to tell. Let the interactivity of your charts invite the audience into conversation, a dialogue spurred by the dynamic beauty of data.
Go forth, and let the charts you create be a beacon, dazzling through the noise, guiding your audience to the aha-moment, the point where data meets decision and insight.
If you liked this article about creating interactive charts, you should check out this article about financial charts and graphs.
There are also similar articles discussing interactive charts, comparison chart makers, comparison charts, and React chart libraries.
And let’s not forget about articles on javascript chart libraries, chart generators, examples of good graphs, and animated charts.


