
Imagine you’re an artist. Except, instead of paint, you wield numbers that tell a financial tale—capturing profit peaks and valley drops of expenses in crystal-clear clarity. Enter the realm of financial data visualization tools, the unsung heroes that turn columns of daunting digits into vibrant, comprehensible stories.
Navigating this digitized landscape, we’re often besieged by an avalanche of raw data—daunting to decipher, let alone leverage for informed decisions. Illuminating fiscal insights with these tools is less about numerical knack and more about visual acuity; a craft where BI software and interactive dashboards become our brushes and palettes.
Within this chronicle, you’ll unlock secrets to weaving intricate money tales, transforming disjointed figures into insightful art. From bar graphs that trace the ebb and flow of sales to heatmaps highlighting investment hotspots, you’ll learn not only to see but understand the financial narratives at a glance.
By the close, expect more than knowledge; envision empowerment to command financial KPIs with the ease of a maestro, steering through the vast sea of data for a port called Clarity.
Table of Contents
Ten Financial Data Visualization Tools To Use
| Tool | Type | Typical Use Cases | Complexity | Primary Visualization Output | Licensing |
|---|---|---|---|---|---|
| wpDataTables | WordPress plugin | WordPress-based tables and chart embedding | User-friendly | Interactive tables and charts | Proprietary |
| QlikView | Standalone application | Business intelligence, data analytics | Moderate to high | Interactive charts, reports | Proprietary |
| Sisense | Standalone application | Full-stack BI, data visualization | Moderate to high | Dashboards, complex charts | Proprietary |
| Zoho Analytics | SaaS/Web application | BI, reporting across multiple data sources | User-friendly | Various chart types, dashboards | Proprietary |
| Power BI | SaaS/Desktop application | BI, reporting, data analytics | User-friendly to moderate | Interactive charts, dashboards | Proprietary |
| Workday Adaptive Planning | SaaS | Financial planning, modeling | Moderate to high | Financial charts, dashboards | Proprietary |
| D3.js | JavaScript library | Custom web data visualizations | High | Highly customizable visuals | Open-source |
| FusionCharts | JavaScript charting library | Web and mobile dashboards, charts | User-friendly | Extensive chart options | Proprietary |
| Tableau | SaaS/Desktop application | In-depth analytics, data storytelling | Moderate | Rich charts, maps, dashboards | Proprietary |
| Google Charts | Web service (JavaScript library) | Basic web visualizations and dashboards | User-friendly | Charts and graphs | Open-source |
Recommended: wpDataTables
If you haven’t heard about wpDataTables then you absolutely should. It’s a game-changer for all you financial analysts, web designers, and developers working in the financial industry.
Trust me, this tool is going to revolutionize how you visualize and present complex financial data online.

- Elevate Your Data Game: With wpDataTables, you can create stunning and interactive charts, graphs, and tables, making it a breeze to turn heaps of data into visually appealing and easy-to-understand formats. Say goodbye to dull spreadsheets!
- Effortless Integration: wpDataTables is based on WordPress. Just install it, and you’re good to go!
- Real-Time Updates: wpDataTables automatically syncs with your data source, ensuring you always have the latest information at your fingertips.
- Customization Galore: Want to match your brand or client’s style? wpDataTables offers a wide range of customization options, so you can tweak colors, fonts, and layouts to your heart’s content.
- Filter and Sort Like a Pro: Save time with advanced filtering and sorting capabilities. Drill down into your data, find the insights that matter, and get the answers you need – fast.
- Responsive and Mobile-Friendly: Mobile devices are everywhere. Guess what? wpDataTables is fully responsive and works like a charm on any screen size. Your data may be great but now it will also look amazing, whether it’s on a tiny smartphone or a 4K monitor.
- Top-Notch Support: Stuck or need help? The friendly and knowledgeable wpDataTables support team is just an email away.
If you’re looking to elevate your financial data visualization game and impress your clients, wpDataTables is the way to go. Don’t miss out on this opportunity to supercharge your data presentations.
Want to know more? Check out all the awesome features that wpDataTables has and give your financial data the visual makeover it deserves.
QlikView
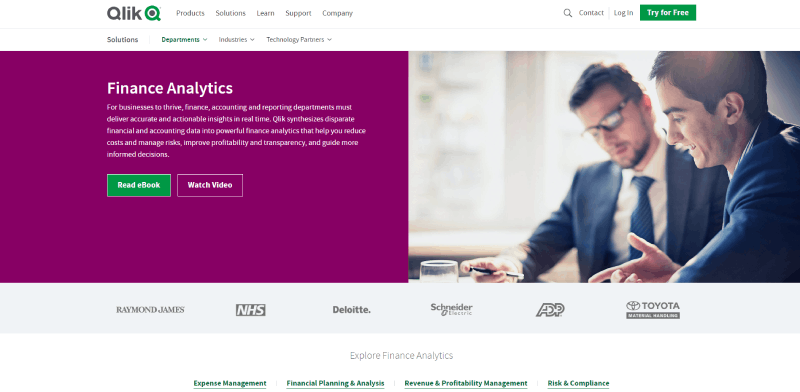
QlikView is one of the most popular financial data visualization tools. It focuses on helping business departments get real-time, accurate, and actionable insights.
Thus, it helps you maintain compliance and reduce costs while managing risks within your operation. This way, you can improve profitability, transparency, and guidance for decision-making processes.
Similar to other data visualization software alternatives, QlikView has native templates and charts. It also supports numerous filtering options to ensure it uses the right data in each graphic.
Despite its many advantages, this tool has a steep learning curve. It demands some research and training time.
Because of this, it might be a better option for larger organizations. However, you benefit from its comprehensive documentation. You can access the tool’s resource library, free trials, and a unique training portal.
Sisense
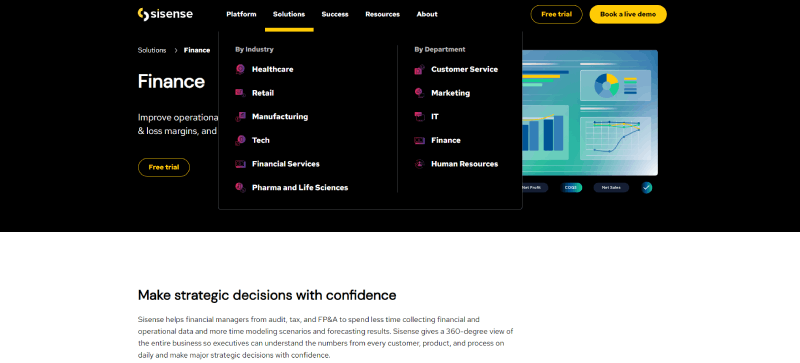
Sisense is a unique business intelligence and data visualization software. It delivers ingrained analytics and infusion apps to streamline cash flow management.
With this tool, you understand profit and loss margins and how to improve operational efficiencies. This way, you can confidently make strategic decisions and set more realistic goals for your business.
Sisense helps you visualize data in different formats to suit various industries and departments. Finance teams can use it to build interactive charts and engaging dashboards to represent intricate data.
You can connect it to multiple data sources and access it anywhere and from any device. Plus, it scales with your business. You can integrate it with Git and build interactive widgets.
Like other tools, Sisense offers diverse supporting resources, from whitepapers to training courses. It even covers an embedded playground for developers to explore its customization possibilities.
Zoho Analytics
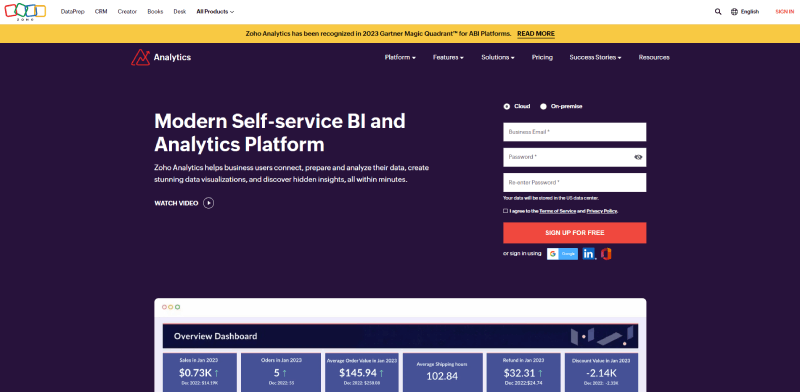
Zoho Analytics is a data visualization platform that merges business intelligence and analytics. Besides enabling various types of data visualization, it has a massive selection of resources.
You get a comprehensive dashboard to support your business activity and track sales performance. It shows you accurate data at the best moment to help you make solid, informed decisions in minutes.
Zoho Analytics has conquered millions of active users worldwide. It approaches all the aspects that make data visualization important. It simplifies data science, supporting business members while they transform and analyze information.
This data visualization platform allows you to build dashboards and charts with a low or no-code model. Then, you can use Zoho Analytics to share them as stories with other users.
Power BI
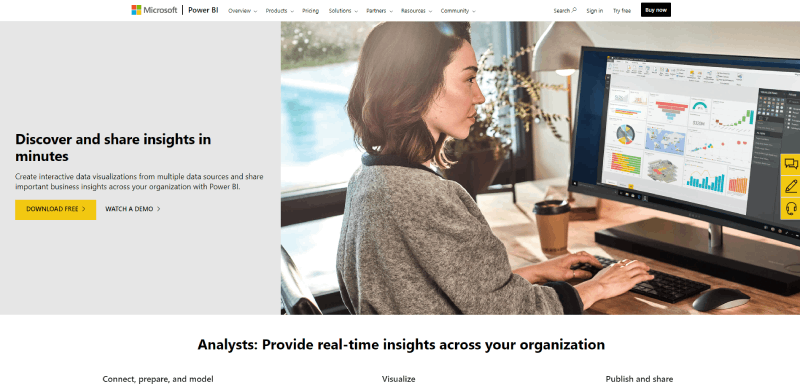
Microsoft Power BI is a tool that allows you to create interactive data visualizations from multiple data sources. It focuses on helping you deliver real-time data analytics to your business collaborators.
This software has specific features that support the efficient treatment of financial data. You get extensive documentation to use the native templates and leverage from its other tools.
Another advantage lies in the possibility of integrating it with Microsoft Excel. Doing so will streamline processes like data compilation, analysis, and transformation.
You can use Microsoft Power BI for intricate and sizable data sets without affecting its responsiveness. Plus, you can use its drag-and-drop feature and point-and-click analysis to build models automatically.
You can download this business intelligence tool for free or opt for one of the other paid license options available. Thus, with Power BI, you will save even more time and increase your business possibilities.
Workday Adaptive Planning
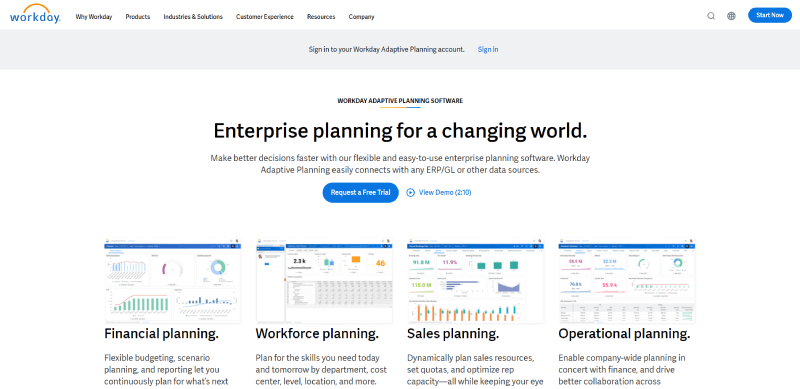
Workday Adaptive Planning is a comprehensive and scalable tool that adapts to any business. It covers financial, operational, and workforce planning and tracks sales performance.
It brings the value of Artificial Intelligence (AI) and machine learning to help you respond to market needs as soon as they arise.
Plus, its impact transcends financial departments affecting your whole organization. This tool helps support efficient Human Resources, Enterprise Risk, and Customer Relationship Management.
You will get multiple integration opportunities with Workday Adaptive Planning. Other team members can access and help complement your data visualizations. You can also refer to various data sources simultaneously.
You can request a free trial of this powerful tool or a demo for its continuous planning program. There are fitted solutions for different roles, industries, and operation sizes.
D3.js
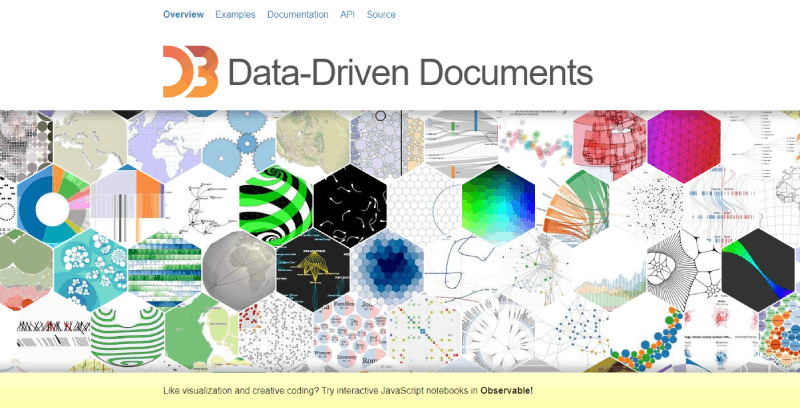
D3.js is the right tool to build financial data visualizations based on intricate data sets. This JavaScript charting library manipulates documents using HTML, SVG, and CSS.
It delivers optimum data visualization capabilities through responsive and interactive charts. Your maps with D3.js display smooth animations, allow various filtering options, and respond to zooming on screen.
It comes with built-in functions for area, line, and pie charts. You can even create reusable maps and other graphics in NVD3 and WebGL. Overall, this visualization tool provides you with key features your projects might require.
The only downside to this option is that you must have some knowledge of JavaScript to use it properly. Previous experience in transforming or managing data will also reduce your learning curve.
FusionCharts
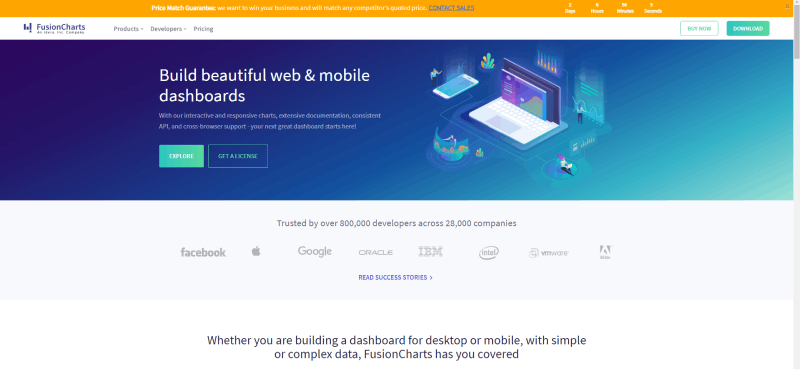
FusionCharts is a reliable chart library for professionals in every line of business. It delivers interactive JavaScript charts, responsive for both desktop and mobile devices.
Its goal is to build comprehensive dashboards with features to follow data evolution over a given time period. Nevertheless, you can also use it to create various types of data visualization.
FusionCharts integrates with common JavaScript frameworks and responds to various programming languages. It includes accessible coding. Even those with limited experience in programming and data manipulation can use it.
You also benefit from a consistent API and access to extensive documentation. Thus, you can easily choose visualization types to represent your data properly.
Tableau
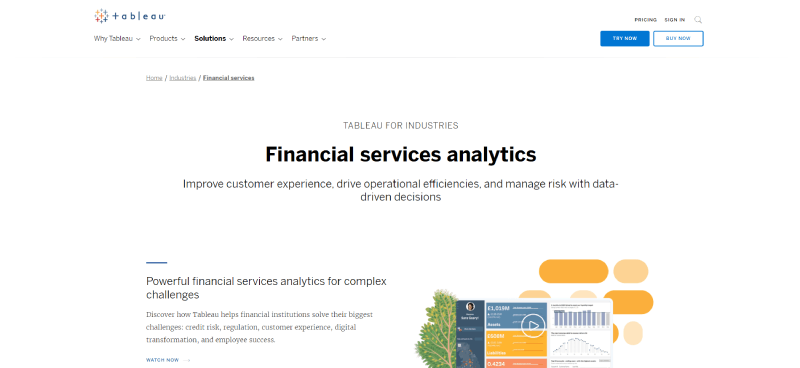
Tableau brings financial services analytics to various industries. It focuses on addressing the complex business challenges that financial organizations face.
Its features improve customer experiences and service offerings and drive operational efficiencies. Its build also supports proper risk management through data-driven decisions.
It is one of the most popular data visualization tools, with an increasingly active community. You can access it from different devices. Besides, it integrates with your preferred Customer Relationship Management tools.
You can request a free trial of Tableau from its website or opt directly for one of its paid subscriptions. According to your business needs, you can also request a customizable plan.
Google Charts
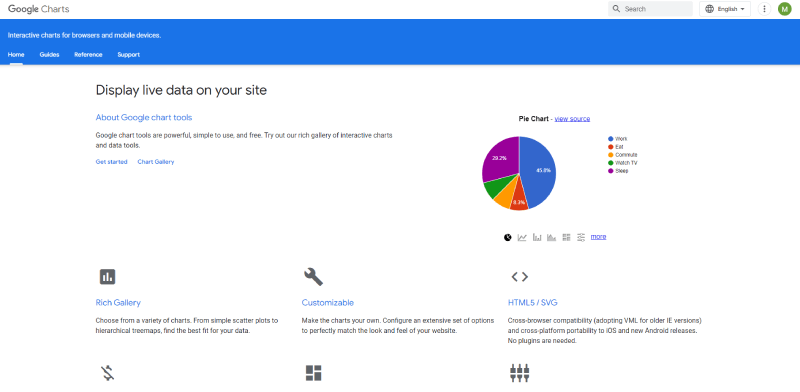
Google Charts delivers one of the most powerful options on this list. Google has developed several tools to support and empower users in their personal and business activities.
This free and user-friendly resource helps you display live, dynamic data on your website. You can select from its rich gallery of charts and graphics, like scatter plots, stacked bar charts, and others.
Another valuable feature is its interactive dashboard, a well-rounded analytics platform. You can use it to connect and control all of your maps.
The charts you build with Google Charts maintain responsiveness regardless of the device and browser. They provide a visual representation of data from multiple locations.
Additionally, you can customize some details of your own if you have some knowledge of CSS.
FAQ on Financial Data Visualization Tools
What exactly are financial data visualization tools?
They’re like your financial story translators. Picture a pile of numbers from stuff like your balance sheet or sales data; these tools morph them into charts and dashboards. You get your data in visuals that make trends and patterns pop so you can make those crucial money moves. Whether you extract that data from sales reports, a bank statement, or any other source, being able to translate bland or inscrutable figures into a far more appealing and digestible form will have a transformative impact on the way you manage your money, especially if you’re a novice in this arena.
How do these tools help in financial analysis?
Alright, so you’ve got tons of data—big deal, right? But wait, with these visualization wizards, you’re turning that raw data stream into meaningful visuals. This way, you quickly grasp where the money’s flowing and can spot issues or victories without wading through number soup.
Can financial data visualization improve decision-making?
Totally! It’s about seeing the big picture. When data’s visually broken down, decision-makers can spot key trends and metrics—like ROI—in a snap. It lays all the cards on the table (or screen), making it easier to call the smart plays without guesswork.
Is there a learning curve for these tools?
Not gonna lie, some tools have a bit of a climb, especially if you’re eyeing the beefy ones like Tableau or Power BI. But hey, even if you’re not a data scientist, there’s user-friendly software out there that won’t leave you scratching your head.
How customizable are visualization tools for financial data?
Tons! They’re like digital Legos for data geeks. You can tweak and twist ’em to reflect whatever matrix you’ve got on your mind, be it profit ratios or fancy pie charts that show your spending habits. It’s all about getting the visual that speaks to you.
What are the costs associated with these tools?
Here’s the deal: there’s a range. Want the basic stuff? Might even find freebies or pay a modest fee. Fancy more horsepower? Premium tools can run a bit steeper. Just balance the price tag with the fireworks you need for your financial storytelling.
What kind of data can be visualized with these tools?
If it’s a number, you can probably jazz it up. From straightforward sales figures to intricate Monte Carlo simulations—you name it. These tools are champs at turning economic intel, market trends, whatever financial data you throw at them, into visuals that don’t make you yawn.
Who typically uses financial data visualization tools?
Think of it as essential gear for the finance Avengers. Financial analysts, CFOs, portfolio managers—they all bring these tools to the battle. But hey, it’s not an exclusive club. Small business owners and wanna-be data experts are starting to rock these tools, too.
How do these tools handle data security?
This is like the VIP section of the data club—tight security’s key. Most top-drawer tools come with built-in features that guard your numbers like a digital fortress. Encryption, access controls—you name it, these tools are on it to keep your financial secrets, well, secret.
How does financial data visualization tie into forecasting and planning?
Here’s where it gets spicy. By painting your financial history, these tools help you see what’s next. You can test out scenarios or let machine learning toss up forecasts. It’s a crystal ball scenario, helping you brace for the financial future.
Conclusion
Wrapping this up, it’s clear that mastering financial data visualization tools goes beyond making pretty pictures. It’s a game-changer for anyone tired of numbing spreadsheets.
- Interactive dashboards turn budget reviews into a less groan-worthy activity.
- Fancy line graphs and pie charts are not just for aesthetics; they’re pivotal for spotting the wins and red flags in your fiscal story.
- Knowing these tools feels a bit like having superpowers — visualizing economic trends and portfolio performance with just a few clicks.
The essence? It’s all about making complex data digestible. Whether it’s untangling complicated financial models or boiling down big data analytics to straightforward visuals. And that’s invaluable because, at the end of the day, seeing is understanding. So take these insights, ride the data wave, and watch those numbers come to life. Here’s to making informed decisions without losing your mind in a sea of endless digits!
If you liked this article about financial data visualization tools, you should check out this article about data visualization blogs.
There are also similar articles discussing scientific data visualization, data visualization challenges, data visualization for marketers, and data storytelling examples.
And let’s not forget about articles on data journalism examples, big data visualization, visualizing large data sets, and data visualization trends.


