Numbers alone do not tell the full story. That is exactly why financial charts and graphs exist.
Whether you are analyzing stock price movement on TradingView, building a revenue dashboard in Power BI, or reading a candlestick pattern before a trade, the right visual format changes how fast you understand what the data is actually saying.
This guide covers everything from chart types used in trading and technical analysis to the graphs that belong in business reports and investor presentations.
By the end, you will know:
- Which chart types work for trading vs. financial reporting
- How to read price action, volume, and technical indicators
- Which tools and platforms to use for each context
- How to pick the right chart for your specific data
Table of Contents
What Are Financial Charts and Graphs
Financial charts and graphs are visual representations of financial data. They convert raw numbers into a format that shows price movement, volume, time relationships, trends, and financial performance at a glance.
The terms are often used interchangeably, but there is a real difference worth knowing.
Charts are primarily used in trading and market analysis. They track price action over time, including open, high, low, and close data. Graphs is the broader term, covering any visual representation of financial data, including those used in business reports, dashboards, and investor presentations.
Put simply: all trading charts are graphs, but not all financial graphs are trading charts.
You find them everywhere. TradingView, Bloomberg Terminal, MetaTrader 5, Microsoft Excel, Power BI, Tableau. Each platform serves a different audience, but the core purpose is the same: make financial data readable without having to stare at a spreadsheet for an hour.
According to QuantifiedStrategies research, 66% of traders use daily charts as their primary tool for market observation and analysis. That number alone says a lot about how central chart reading is to trading decisions.
For financial data visualization to work, the visual has to match the question being asked. Choosing the wrong chart type is one of the most common mistakes in both trading and financial reporting. The sections below cover exactly that.
Free Chart Type Picker
Types of Financial Charts Used in Trading and Analysis
Trading platforms give you a lot of chart types to choose from. Most traders pick one or two and stick with them. But knowing what each one actually does changes how you read price action.
| Chart Type | What It Shows | Best For |
|---|---|---|
| Line Chart | Closing prices over time | Trend direction, long-term overview |
| Bar Chart (OHLC) | Open, high, low, close per period | Detailed price range analysis |
| Candlestick Chart | OHLC with visual body and wicks | Pattern recognition, short-term trading |
| Renko Chart | Price movement only, ignores time | Filtering noise, identifying trend blocks |
| Point and Figure | Price change only, no time axis | Support/resistance, clean breakout setups |
Line charts are the simplest. They connect closing prices and show trend direction fast. You lose volume and intraday movement, but sometimes that clean view is what you need.
Heikin-Ashi charts are a smoothed variation of candlesticks. They recalculate open and close values to reduce noise. Useful for trend trading, less useful for precise entry timing.
Candlestick Charts vs. Bar Charts
Chart created with wpDataTables
Candlestick charts were developed in 18th-century Japan, originally used to track rice prices in Osaka. Steve Nison introduced them to Western markets in his 1991 book, and they’ve been on every trading platform since.
The core difference comes down to readability. Both show OHLC data, but candlesticks encode it visually through body color and wick length. A filled red body means price closed lower than it opened. A hollow or green body means the opposite. Bar charts show the same data with horizontal tick marks on a vertical line.
Most traders prefer candlestick charts for one reason: pattern recognition is faster. Doji, hammer, engulfing patterns, shooting stars. These are all things your eye picks up in a second on a candle chart. On a bar chart, you’re doing more mental work.
Platform defaults vary. TradingView and Thinkorswim both default to candlesticks. Bloomberg Terminal gives you OHLC bars as the institutional standard.
For a direct breakdown of how these two compare structurally, the line chart vs. candlestick comparison is also worth reading if you’re deciding which format to standardize on.
Types of Financial Graphs Used in Reports and Dashboards
Business reporting has different needs than trading. You’re not tracking tick-by-tick price movement. You’re presenting revenue, expenses, margins, or portfolio allocation to people who may not read charts every day.
The graph types that work in this context are different from trading charts, and picking the wrong one can make a solid financial story look confusing.
Common Graph Types in Financial Reporting
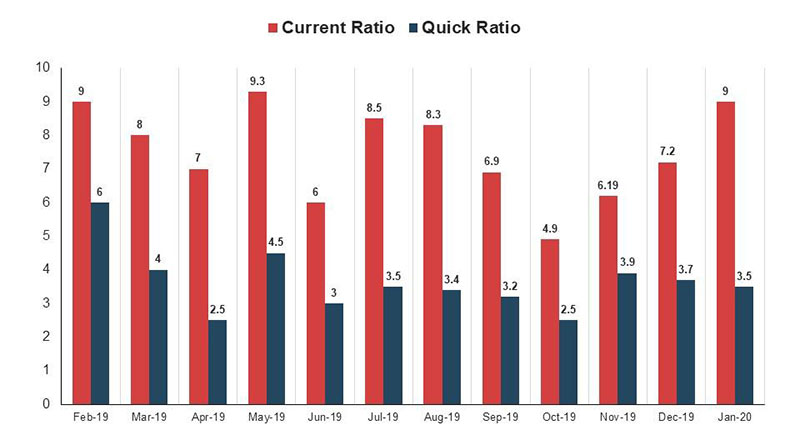
Bar and column graphs are workhorses. They compare values across categories or time periods clearly. Revenue by quarter, expenses by department, year-over-year comparisons. Microsoft Excel and Google Sheets both handle these without any setup.
Waterfall charts are underused. They show how a starting value increases or decreases through a series of steps, ending at a final value. CFOs love them for showing how EBITDA flows from revenue to net income. Power BI has a solid native waterfall chart builder.
Pie and donut charts handle proportions. Portfolio allocation, budget breakdowns by category, revenue split by product line. They work when you have a small number of segments. More than six slices and it gets messy. For a direct comparison, see pie chart vs. donut chart.
Scatter plots map relationships between two variables. Risk vs. return analysis is the classic financial use case. You can spot correlations, outliers, and clustering that bar charts completely miss.
Graphs for Investor-Facing Content
Annual reports and investor presentations use a tighter set of visuals. The goal shifts from internal analysis to communication.
- Area charts for showing revenue growth over time with volume feel
- Stacked bar charts for revenue by segment across periods
- Column charts for quarterly earnings comparisons
- Gauge charts for KPI dashboards showing targets vs. actuals
One thing that gets ignored in investor-facing reports: truncated axes. A bar chart that starts at $90M instead of $0 makes a small difference look huge. This is a well-documented issue in financial communication and it gets companies in trouble with regulators.
How to Read a Financial Chart
Took me a while to figure out that reading charts is mostly about context, not the chart itself. A single candle means nothing. A candle in the context of the 20 days before it means a lot.
Here is the foundation.
The Axes and What They Tell You
The X-axis is almost always time in financial charts. Left to right, older data to newer data. The Y-axis is price or value, scaled to the asset or metric being tracked.
Logarithmic vs. linear scaling matters more than most beginners realize. A linear scale shows equal dollar distances. A logarithmic scale shows equal percentage moves. For long-term stock charts, log scale gives a more accurate picture of growth. Most platforms let you toggle this.
Volume Bars and What They Confirm
Volume bars sit at the bottom of most trading charts. They show how many units traded in each period.
High volume on a price move confirms it. Low volume on a price move makes it suspicious. That’s the rule. A breakout above resistance on low volume is usually a false move. The same breakout on heavy volume is something to take seriously.
Most traders I know check volume before they check indicators. It is the one thing that does not lag.
Trend Identification
Three structures worth knowing:
- Uptrend: higher highs and higher lows
- Downtrend: lower highs and lower lows
- Sideways consolidation: price bouncing between a floor and a ceiling
Support is a price level where buying has historically shown up. Resistance is where selling has shown up. These levels are not magic lines. They are areas where market participants have acted before and may act again.
For a broader look at how these principles apply across different visual formats, data visualization principles covers the underlying logic well.
Your beautiful data deserves to be online
wpDataTables can make it that way. There’s a good reason why it’s the #1 WordPress plugin for creating responsive tables and charts.

And it’s really easy to do something like this:
- You provide the table data
- Configure and customize it
- Publish it in a post or page
And it’s not just pretty, but also practical. You can make large tables with up to millions of rows, or you can use advanced filters and search, or you can go wild and make it editable.
“Yeah, but I just like Excel too much and there’s nothing like that on websites”. Yeah, there is. You can use conditional formatting like in Excel or Google Sheets.
Did I tell you you can create charts too with your data? And that’s only a small part. There are lots of other features for you.
Chart Timeframes and What They Show
The same stock can look like a strong uptrend on a weekly chart and a complete mess on a 5-minute chart. Timeframe selection is not a minor detail. It defines what story the chart tells.
| Timeframe | Common Use | Typical Users |
|---|---|---|
| 1-min / 5-min | Entry and exit timing | Day traders, scalpers |
| 15-min / 1-hour | Intraday trend structure | Active traders |
| Daily | Swing trade setups, primary trend | Swing traders, most retail traders |
| Weekly | Medium-term trend confirmation | Position traders, fund managers |
| Monthly | Long-term trend and macro view | Investors, analysts |
QuantifiedStrategies data shows 66% of active traders rely on daily charts as their primary reference. That makes sense. The daily chart smooths out intraday noise and still shows you enough price action to make decisions.
Multi-Timeframe Analysis
Most professional traders use at least two timeframes together. The higher timeframe defines the trend. The lower timeframe finds the entry.
A common approach: check the weekly chart to confirm trend direction, then drop to the daily for a setup, then to the 4-hour for precise timing. The idea is that you only take trades in the direction of the larger trend.
TradingView handles multi-timeframe analysis well. You can sync layouts, run multiple charts side by side, and set alerts on different timeframes without leaving the platform.
Timeframe and the Story It Tells
A stock that dropped 40% over three years can show a beautiful short-term uptrend on a 30-day chart. Neither view is wrong. They answer different questions.
Long-term investors care about monthly and quarterly charts. Swing traders focus on daily and weekly charts. Day traders rarely look beyond the hourly. Picking a timeframe before you open a chart is not optional.
Technical Indicators on Financial Charts
Indicators are calculations applied to price or volume data. They do not predict the future. They describe what has already happened in a format that is easier to scan than raw price action.
The real problem with indicators is not that they don’t work. It’s that traders layer on 8 of them and then wonder why every chart looks like a mess.
Moving Averages
Moving averages are the most widely used indicators on any platform. The simple moving average (SMA) averages closing prices over a set period. The exponential moving average (EMA) gives more weight to recent prices.
- 20 EMA: short-term trend, used by swing traders for dynamic support
- 50 SMA: medium-term benchmark, watched closely by institutional traders
- 200 SMA: long-term trend definition, the most referenced line on S&P 500 and NASDAQ charts
Crossovers get a lot of attention. When the 50 SMA crosses above the 200 SMA, traders call it a “golden cross.” The reverse is a “death cross.” These signals lag, but they are widely followed, which makes them self-reinforcing to a degree.
Momentum Indicators: RSI, MACD, Stochastic
RSI (Relative Strength Index) measures the speed and size of recent price changes on a 0-100 scale. Readings above 70 suggest overbought conditions. Below 30 suggests oversold. It does not mean reverse immediately. Assets can stay overbought for weeks in a strong trend.
MACD (Moving Average Convergence Divergence) shows the relationship between two EMAs. When the MACD line crosses above the signal line, it’s a bullish signal. Below is bearish. The histogram shows the distance between them.
Stochastic oscillator compares a closing price to its price range over a set period. Useful for spotting momentum shifts in ranging markets. Less reliable in trending ones.
Volatility and Volume Indicators
Bollinger Bands place two standard deviation bands around a moving average. When price touches the upper band, volatility is high. When the bands squeeze tight, a breakout is often building. This is one of the cleaner signals on the chart.
ATR (Average True Range) measures volatility in absolute terms. Useful for position sizing. If a stock has an ATR of $3, a $0.50 stop loss is noise.
VWAP (Volume Weighted Average Price) is a day trading staple. It shows the average price weighted by volume over the trading day. Institutional orders tend to cluster around VWAP. Price above VWAP is generally bullish intraday. Below is bearish.
OBV (On-Balance Volume) tracks cumulative volume direction. A rising OBV during a sideways price range often signals that buying pressure is building before a price move.
For those building indicators programmatically, Chart.js is worth exploring. It handles custom financial overlays and integrates cleanly with data pipelines. There are also various Chart.js plugins that extend its charting capability for more complex financial visualizations.
Financial Chart Patterns Traders Actually Use
Chart patterns are repeating price formations that signal potential continuation or reversal of a trend.
They are not guarantees. But they are probabilities, and in trading, that is all you are looking for.
Liberated Stock Trader research shows the most reliable patterns include the inverse head and shoulders, double bottom, and triple bottom, each with a proven success rate above 85% and an average gain of 43%.
Reversal Patterns
These form when a trend is losing momentum and price is likely to change direction.
- Head and shoulders: three peaks, middle one highest, signals a bearish reversal with an 83% average success rate (TradeFundrr research)
- Double top / double bottom: two peaks or troughs at similar prices, 72% reliability on confirmed breakouts
- Rounding bottom: a gradual U-shaped curve, signals a slow shift from bearish to bullish momentum
Volume confirmation matters a lot with reversals. A head and shoulders pattern on low volume is far less reliable than the same pattern with volume rising on the right shoulder.
Continuation Patterns
A study covering over 8,000 chart setups from 2020 to 2023 found that pattern-based trades with volume and RSI confirmation reached a 62% average success rate (VPFX research, 2025).
Continuation patterns suggest a pause in the current trend before it resumes. Flags, pennants, and triangles are the most common.
Ascending triangle: horizontal resistance, rising support. Breakout above the flat line continues the uptrend. Predictive accuracy sits around 83% (Liberated Stock Trader).
Bull flags follow sharp rallies. A short, orderly pullback forms the flag. The breakout resuming the original trend is the trade. Standard bull flags fail 55% of the time. The high-tight flag variant has an 85% win rate.
How Volume Confirms Breakouts
No volume, no breakout. That is the simplified version, but it holds.
What rising volume on breakout signals: genuine institutional buying, not a retail-driven spike likely to reverse fast.
FinViz’s pattern recognition scanner and TradingView’s built-in pattern detection both flag formations across hundreds of assets simultaneously. These tools save time but do not replace the judgment call on whether volume is backing the move.
For a broader look at how bar charts and comparison visuals differ from pattern-based chart reading, that context is worth understanding before applying these patterns to your own workflow.
Financial Graphs in Business Reporting
Trading charts and business reporting graphs solve different problems. The confusion is that both get called “financial charts” when they serve completely different audiences.
Research published in the Journal of Accounting and Economics (2024) found that firms using graphs in annual reports earned approximately 3.5% abnormal returns in the six months following first-time graphics use, alongside increased institutional holdings. Findings like these have helped make financial data visualization a recurring topic in CPE podcasts, particularly among accounting and finance professionals focused on financial reporting and investor communications.
Standard Graph Types in Annual Reports
Most publicly listed companies keep their visual toolkit small.
Line graphs for showing cumulative shareholder returns over specific periods. This is the most common chart in 10-K filings, used specifically to compare company performance against major indexes like the S&P 500.
Bar and column charts for revenue comparisons, operating income year over year, and segment-level breakdowns. Simple, scannable, and familiar to any investor reading a report.
Waterfall charts are the clearest way to show how EBITDA flows from gross revenue to net income. Deloitte and PwC both use them regularly in financial advisory presentations. Power BI and Excel both have native waterfall chart builders.
Misleading Graphs in Financial Communication
This is a real problem, not a theoretical one. Truncated Y-axes make minor changes look dramatic.
A revenue chart starting at $90M instead of $0 can make a $2M quarterly gain look like a massive leap. Investors notice. Regulators notice too.
Common manipulation tactics to watch for:
- Y-axis that does not start at zero on bar charts
- Inconsistent time intervals on the X-axis
- Cherry-picked date ranges that exclude unfavorable periods
- Dual-axis charts where scales are manipulated to imply false correlation
For a deeper look at how graphs can distort rather than clarify, misleading statistics covers the mechanics of how this happens in practice.
Tools Used in Corporate Financial Reporting
Microsoft Excel is still the dominant tool. Most investor-facing charts in annual reports start in Excel.
Power BI connects directly to Bloomberg data via BQL for PORT Enterprise, letting portfolio teams push reporting datasets directly into Power BI and Tableau dashboards without manual exports. That workflow has largely replaced static Excel charts in institutional reporting environments.
For web-based financial reporting dashboards, financial reporting software options vary widely in capability and cost. The right choice depends on how frequently reports update and who the primary audience is.
How to Choose the Right Chart or Graph for Financial Data
Wrong chart type is one of the most common mistakes in both trading and financial reporting. It sounds obvious until you see a pie chart used to show revenue trends over time.
The question to ask first: what is the data relationship I’m trying to show?
| Question You’re Answering | Right Chart Type | Wrong Chart Type |
|---|---|---|
| How did revenue change over time? | Line chart, area chart | Pie chart, bar chart |
| How do regions compare this quarter? | Bar chart, column chart | Line chart |
| What share does each segment hold? | Pie chart, donut chart | Line chart, scatter plot |
| Do marketing spend and revenue correlate? | Scatter plot | Bar chart, pie chart |
| How does cash flow build from revenue to net income? | Waterfall chart | Line chart |
Trading Context vs. Reporting Context
These are genuinely different environments with different rules.
Trading context: time series charts, OHLC or candlestick format, technical overlays, volume bars. Speed of interpretation matters more than aesthetics.
Reporting context: bar, column, waterfall, and donut charts. Audience clarity matters more than technical precision. Executives reading a board report are not looking for RSI levels.
Mixing these up causes real problems. I have seen trading-style charts dropped into investor presentations, which confuse the audience and undermine the report’s credibility.
Audience and Format Decisions
The audience determines nearly everything about chart selection.
- Internal analysts: can handle complexity, multi-series charts, dense data
- C-suite: wants one takeaway per visual, minimal labels, clear trend lines
- External investors: familiar with standard financial report formats, expects consistency with industry norms
- Retail audience: needs the simplest possible visual, single metric per chart
For practical guidance on matching visual format to data type, how to choose the right chart for your data is a solid reference. And if you’re working on the data storytelling layer around those visuals, data storytelling covers how to build a narrative around the numbers rather than just displaying them.
The line chart vs. bar chart comparison is worth reading specifically for the cases where either could technically work but one is clearly better given the data structure.
FAQ on Financial Charts Graphs
What is a financial chart?
A financial chart is a visual representation of market data over time. It plots price movement, volume, or financial metrics in a format that is faster to read than raw numbers. Most trading platforms like TradingView and Bloomberg Terminal display them by default.
What is the difference between a financial chart and a financial graph?
Charts typically refer to trading visuals like candlestick charts or OHLC bar charts used in technical analysis. Graphs is the broader term, covering bar graphs, pie charts, and scatter plots used in business reporting and dashboards.
What are the most common types of financial charts?
The most widely used are line charts, bar charts, and candlestick charts. Point and figure, Renko, and Heikin-Ashi charts are popular among technical traders who want to filter out market noise.
What is a candlestick chart and why do traders use it?
A candlestick chart shows the open, high, low, and close price for each period using a colored body and wicks. Traders prefer it because pattern recognition, including doji, hammer, and engulfing patterns, is faster visually than with bar charts.
How do you read a stock price chart?
Start with the X-axis for time and the Y-axis for price. Identify the trend direction using higher highs or lower lows. Check volume bars at the bottom to confirm whether price moves have genuine buying or selling pressure behind them.
What is the best chart type for financial reporting?
It depends on the data. Use waterfall charts for showing cash flow or EBITDA builds. Use bar or column charts for comparisons. Use line charts for trends over time. Pie and donut charts work for portfolio allocation breakdowns with fewer than six segments.
What technical indicators are most used on financial charts?
Moving averages (SMA and EMA), RSI, MACD, and Bollinger Bands are the most widely used. VWAP is standard for intraday traders. Most active traders use two or three indicators maximum to avoid conflicting signals on the same chart.
What is the best platform for financial charting?
TradingView is the most popular for retail traders, with over 100 million users globally. Bloomberg Terminal is the institutional standard. For business dashboards and financial reporting graphs, Power BI and Tableau are the go-to tools for most finance teams.
What chart timeframe should I use for trading?
It depends on your trading style. Day traders use 1-minute to 15-minute charts. Swing traders rely on daily and weekly charts. Long-term investors focus on monthly charts. Most professionals use multi-timeframe analysis, combining at least two timeframes to confirm trade direction.
What is the difference between a line chart and a candlestick chart?
A line chart connects only closing prices, giving a clean trend view with minimal detail. A candlestick chart shows open, high, low, and close for each period. Traders who use price action analysis almost always prefer candlesticks for the additional context they provide.
Conclusion
This conclusion is for an article presenting financial charts and graphs as practical tools, not just decorative visuals.
Knowing your chart types matters. A candlestick pattern on a daily timeframe tells a different story than a waterfall chart in a board presentation, and confusing the two contexts costs you clarity.
Whether you rely on technical indicators like MACD and Bollinger Bands for price action analysis, or use Power BI and Tableau to build financial dashboards for reporting, the core principle stays the same.
Match the visual to the question you are actually trying to answer.
Get that right, and the data starts working for you.