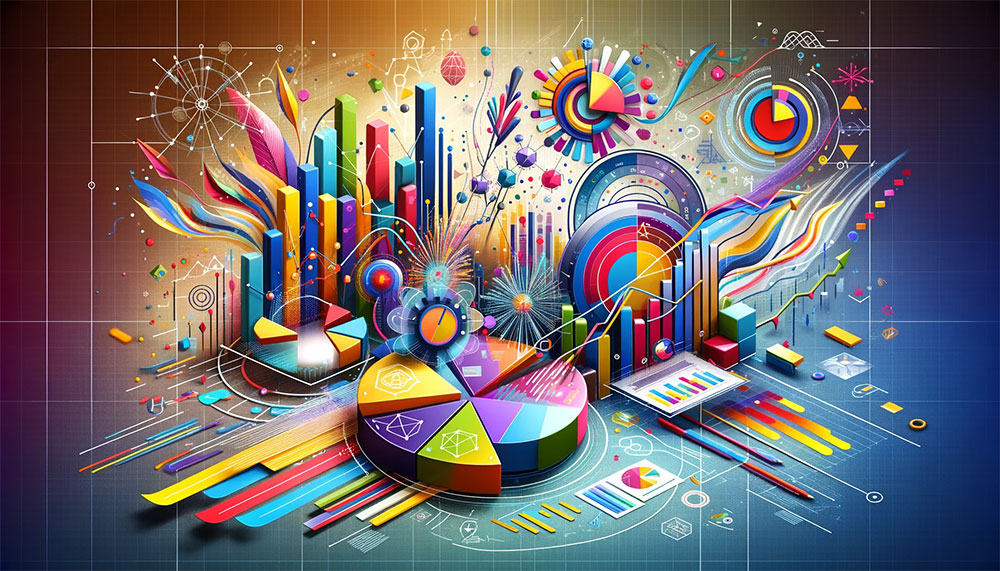
Ever stared at a spreadsheet full of numbers and felt like you’re trying to read an alien language? That’s where the magic of how to present data visually comes in.
It’s all about transforming those cryptic numbers into something that actually makes sense – think vibrant charts, snappy infographics, and dashboards that tell a story at a glance.
This article is your ticket to mastering the art of visual data storytelling.
Whether you’re in marketing, crunching numbers for a corporate report, or just trying to make your school project shine, you’ll learn the ins and outs of turning complex data into visuals that pop.
Table of contents
- Principles of Effective Data Visualization
- Choosing the Right Visualization Method
- Advanced Visualization Techniques
- Data Visualization in Practice
- Creating Engaging Visuals
- Best Practices and Tips
Table of Contents
Principles of Effective Data Visualization
Simplicity and Clarity
Importance of keeping visuals simple and understandable
When you’re showing data, you want people to get it. No one should have to scratch their head trying to figure out what your chart is saying.
Using basic shapes, clear labels, and a neat layout does the trick.
Using basic shapes and colors effectively
Choosing the right colors and shapes is kinda like dressing up for an occasion.
You want to look good but not overdo it. Same with data visuals. Pick colors that pop but don’t clash. Use shapes that are easy on the eyes. The goal is to make your data stand out, not to turn it into a rainbow explosion.
Design and Aesthetics
Role of design principles in data visualization
Design in data visualization is like the secret sauce. Think about balance, contrast, and alignment.
These aren’t just fancy terms; they’re what make your visuals make sense and tell that story effectively.
Balancing aesthetics with functionality
Now, this is crucial. You gotta strike that perfect balance between looking good and being useful.
Your visuals should catch the eye, but they also need to be super clear and informative. You can also change the background to make your design more visually appealing and focused.
Choosing the Right Visualization Method
Overview of Visualization Types
Alright, let’s get into the meat of it. Picking the right way how to present data visually is like choosing the right outfit for an occasion. You’ve got to match the style to the situation.
Line, bar, and column charts
Chart created with wpDataTables
These are your bread and butter. Line charts? Perfect for trends over time.
Think stock market vibes. Bar and column charts?
They’re ace for comparing things.
Pie charts, area charts, and scatter plots
Chart created with wpDataTables
Pie charts are your go-to for showing parts of a whole.
Like, how much of your day is spent scrolling through memes.
They’re similar to line charts but with a bit more pizzazz, showing volumes.
Scatter plots are all about relationships between two things, like the correlation between your caffeine intake and your productivity.
Specialized Visualization Tools
Sometimes, you need something a bit more niche. This is where the fancy tools come in.
Radar, Venn, and bubble charts
Radar charts are like spider webs, great for showing multiple data points. Think skill levels in different areas.
They’re super for showing overlaps, like what you and your bestie both love.
Bubble charts are a bit more playful, perfect for showing data in three dimensions.
Decision trees, fishbone diagrams, and Gantt charts
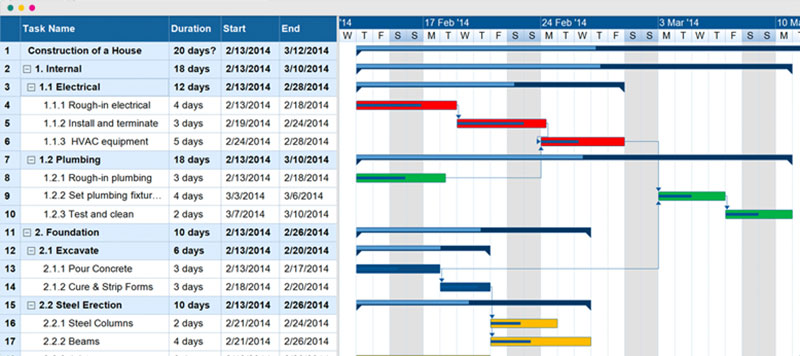
Getting into the serious stuff now. Decision trees help in mapping out pathways and outcomes, like choosing your next Netflix binge.
Fishbone diagrams are fab for root cause analysis, like figuring out why your plant keeps dying. And Gantt charts?
The ultimate tool for project planning. They’re like calendars but way more detailed.
Advanced Visualization Techniques
Interactive and Dynamic Visuals
So, you wanna take your game up a notch in how to present data visually? Time to get interactive and dynamic.
Incorporating interactive elements
Chart created with wpDataTables
Picture this: You’re not just looking at a static chart.
You hover over it, and bam! Info pops up, things move, and it’s like you’re having a conversation with the data.
Interactive elements make your audience part of the story.
They can click, hover, and drill down into what interests them. It’s like giving them the remote control to your data story.
Using animation and dynamic slideshows
Animations aren’t just for Pixar movies. In data viz, they bring your story to life. Imagine a bar chart that grows right before your eyes, showing progress over time.
Or a dynamic slideshow that takes your audience on a journey through the data. It’s all about making your data not just informative, but also super engaging.
Innovative Approaches
Okay, now let’s get a bit wild with some innovative approaches.
Fisheye and Cartesian distortion
See the Pen
Cartesian Fisheye Distortion Heatmap by John Wundes (@johnwun)
on CodePen.
Ever heard of fisheye?
No, not the fish. In data viz, it’s a way to magnify a part of your chart, making the important stuff stand out big time.
And Cartesian distortion? It’s like taking your regular X and Y axes and giving them a twist to highlight certain areas. Think of it as putting a spotlight on the key parts of your data.
Advanced infographics and data storytelling
We’re not just talking about your average infographics. We’re diving into the deep end with advanced designs that are more like art pieces.
And data storytelling?
It’s like being a director of your own data movie. You’re not just showing numbers; you’re telling a story, with a beginning, middle, and end.
Each element, from color to layout, plays a part in getting your message across.
Your beautiful data deserves to be online
wpDataTables can make it that way. There’s a good reason why it’s the #1 WordPress plugin for creating responsive tables and charts.

And it’s really easy to do something like this:
- You provide the table data
- Configure and customize it
- Publish it in a post or page
And it’s not just pretty, but also practical. You can make large tables with up to millions of rows, or you can use advanced filters and search, or you can go wild and make it editable.
“Yeah, but I just like Excel too much and there’s nothing like that on websites”. Yeah, there is. You can use conditional formatting like in Excel or Google Sheets.
Did I tell you you can create charts too with your data? And that’s only a small part. There are lots of other features for you.
Data Visualization in Practice
Diving into the real world of how to present data visually is where things get super interesting.
You see, it’s not just about making cool graphs and charts. It’s about using these visuals in ways that make a real impact.
Application Across Industries
Marketing, education, and research
In marketing, visuals are like the secret sauce. They turn boring sales data into eye-catching infographics that even the least interested person will glance at.
In education, teachers are using visuals to turn complex subjects into easy-to-digest diagrams. And in research?
It’s all about turning those endless data sets into visuals that make sense – think of data storytelling with charts and interactive dashboards.
Corporate presentations and project management
In the corporate world, it’s all about getting your point across clearly and quickly.
Data visualization steps in as a hero, transforming numbers and goals into visuals that stick. Project management too gets a makeover with Gantt charts and timelines that everyone on the team can understand and follow.
Creating Engaging Visuals
When it comes to how to present data visually, making it engaging is key. You’re not just sharing data; you’re grabbing attention and keeping it.
Use of Color and Imagery
Effective use of color patterns
Chart created with wpDataTables
Colors are more than just pretty. They’re powerful. The right combination can highlight important data and guide the viewer’s eye where you want it.
Think about color theory – what colors pop, what blend, and what message they send.
Incorporating high-quality images and icons
And let’s not forget images and icons
They’re like shortcuts to understanding. A well-chosen icon can represent an idea instantly. Images add context, making your data relatable and real.
Organizing and Formatting Data
Structuring data for clarity
Chart created with wpDataTables
It’s all about making your data easy to follow. Each piece of data is part of this story, leading your audience through the narrative.
Labeling and use of headers
Labels and headers are your guiding lights. They tell your audience what they’re looking at, making it easier to understand. It’s like signposting your journey, ensuring no one gets lost in the data.
Best Practices and Tips
Ensuring Accuracy and Relevance
Importance of accurate data
First things first, accuracy is key. Imagine baking with expired flour – disaster, right?
Same with data.
Using old or incorrect data is making you mislead your readers. Always double-check your sources, update your data, and stay on top of the game.
Including all relevant data sets
Now, imagine making a pizza but forgetting the cheese – it’s just not complete. Same goes for your data sets.
Make sure you include all relevant info. It’s like giving a full picture, leaving no stone unturned. You don’t want your audience missing out on important bits.
Consistency in Presentation
Maintaining a consistent visual style
Consistency is your friend. Stick to a style that’s easy on the eyes and coherent. It’s like having a signature dish.
When you see it, you know it’s yours. This helps in branding and making your work instantly recognizable. Plus, it’s just pleasing to look at!
Branding and visual identity
Think of your visuals like your outfit. You want it to speak for you, to show your unique style.
A consistent branding in your visuals helps build that identity. To achieve this consistency, UI UX design services help create cohesive and visually appealing interfaces that strengthen brand identity and improve user experience.
FAQ on Presenting Data Visually
What’s the Best Way to Start Learning About Data Visualization?
Starting with the basics is key. Familiarize yourself with different chart types like bar, line, and pie charts.
Experiment with tools like Excel or Google Sheets. Online courses and tutorials can be super helpful, especially ones focusing on data storytelling and interactive dashboards.
Or you can just use wpDataTables and see how easy it is.
How Do I Choose the Right Chart Type?
It’s all about your data’s story. Bar charts are great for comparisons, line charts for trends over time, and pie charts for showing proportions.
Think about what you want your audience to understand at a glance, and let that guide your choice.
Can Color Choice Impact Data Visualization?
Absolutely! Colors can make or break your visualization. Use contrasting colors for clarity, and avoid overly bright or clashing palettes.
Remember, color isn’t just for aesthetics; it’s a tool for highlighting key data points and guiding the viewer’s eye.
What Are Some Common Mistakes in Data Visualization?
Overcomplicating visuals is a big one. Also, using the wrong chart type for your data, or choosing style over substance.
Another mistake is not tailoring the visualization to your audience. Keep it simple, relevant, and focused on your key message.
How Important Is Interactivity in Data Visualization?
Interactivity can be a game-changer, especially in business intelligence and presentations.
Interactive elements like hover details, filters, and sliders allow viewers to engage with the data on a deeper level. It turns a static image into a dynamic experience.
Are There Any Good Tools for Beginners in Data Visualization?
Sure thing! Tools like Tableau Public and Microsoft Power BI are great for beginners.
They’re user-friendly and have tons of resources to help you get started. Google Data Studio is another good one, especially if you’re looking for a free option.
What Role Does Data Storytelling Play in Visualization?
Data storytelling is huge. It’s about weaving your data into a narrative that’s engaging and easy to understand.
Good storytelling can turn a dry presentation into something memorable. It’s not just about the visuals; it’s about the story they tell.
How Can I Improve My Data Visualization Skills?
Practice, practice, practice. Experiment with different tools and datasets. Study good examples of data visualization and analyze what makes them effective. If you want a more structured foundation, taking a data analytics or online statistics course for college credit through platforms like Portage Learning can sharpen the analytical thinking that makes your visualizations more accurate and intentional.
Keep up with the latest trends in data analytics and visualization techniques.
What’s the Best Way to Present Complex Data?
Simplicity is key. Break complex data into smaller, digestible parts. Use clean layouts and avoid clutter.
Annotations and explanations can help guide the viewer. Sometimes, a series of simple visuals is better than one overly complex chart.
How Do I Make Sure My Visual Data Is Accurate?
Double-check your data sources and the calculations in your visualizations.
Misrepresenting data, even unintentionally, can lead to misunderstandings. Consistent and careful data handling is crucial for maintaining accuracy and trust in your visuals.
Conclusion
From data storytelling in marketing to making those corporate presentations shine, you now have the tools to turn data into dialogue.
The key takeaway?
Keep it simple, make it striking, and always aim to illuminate, not complicate.
If you liked this article about how to present data visually, you should check out this article about categorical data examples.
There are also similar articles discussing nominal vs ordinal data, discrete vs continuous data examples, descriptive statistics, and different types of data.
And let’s not forget about articles on real-time data visualization, primary data vs secondary data, advantages of secondary data, and data visualization principles.


