You’ve surely seen a weather table online, but have you ever tried to build one?
Surely, it would seem a dreadful experience with all the data and conditional formatting that you’d need to add to the table cells.
Do you know how they say there isn’t such thing as bad weather, only unsuitable clothing?
The same goes for building a weather table. If you can’t create one, it means you don’t have the right tools for the job.
In this article, I’ll go over creating a weather table with wpDataTables, the #1 WordPress plugin for creating tables and charts.
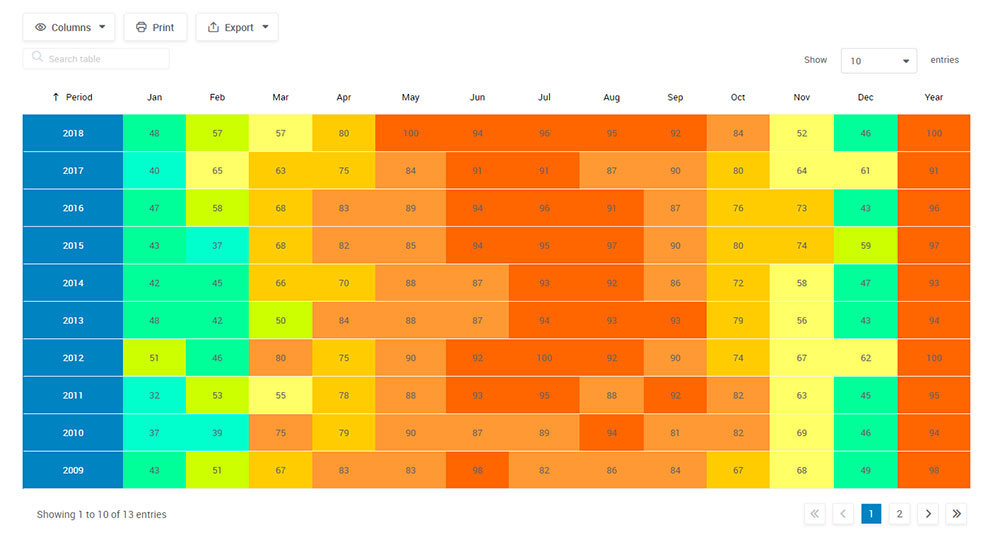
What kind of weather table can we create? Well, something like this:
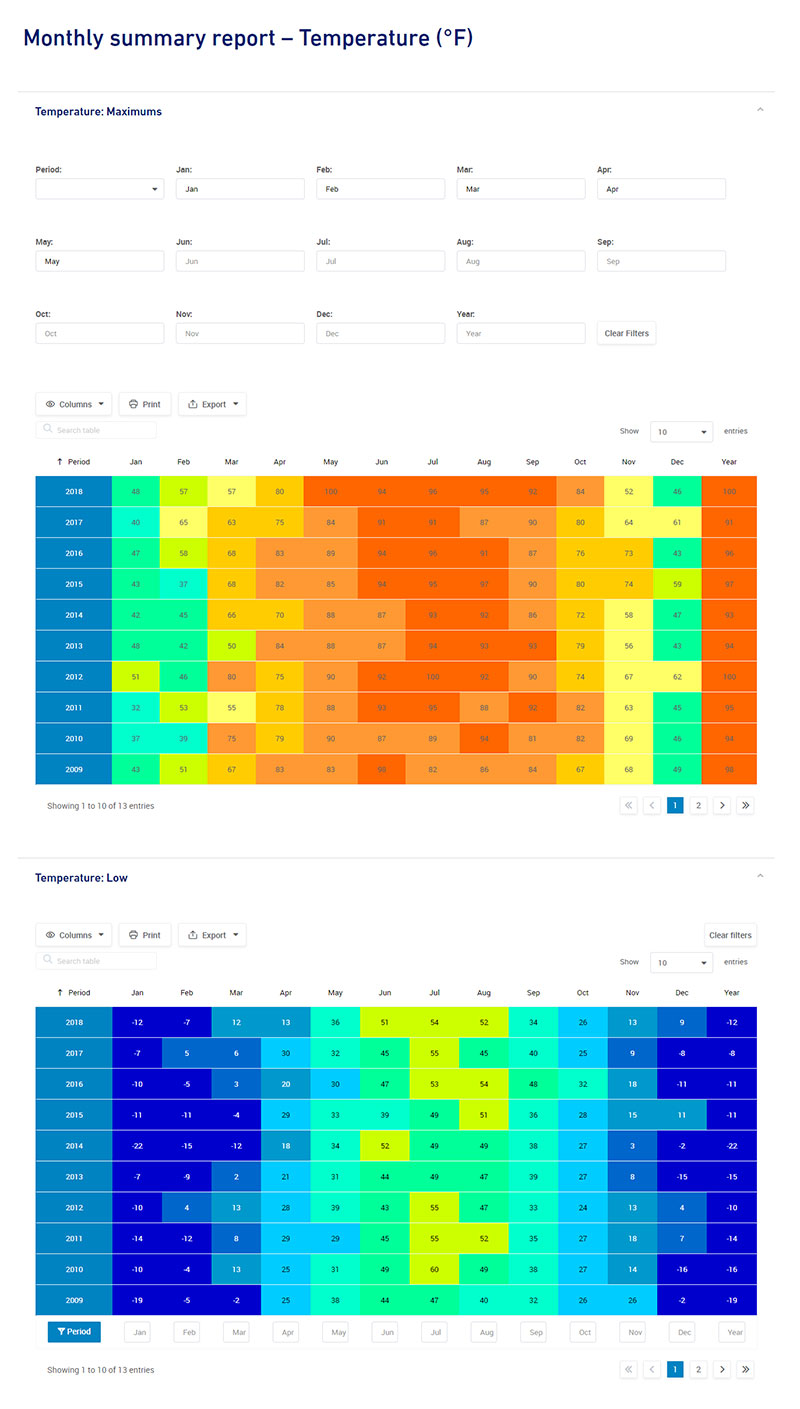
Yes, that is a really long screenshot. You can view the dynamic weather table here.
For creating a weather table like the ones we presented earlier, you have few options depending on your source data.
1. Creating a table from scratch
If you do not have a data source you can create your weather table from scratch with the option “Creating tables manually” where you will insert data manually.
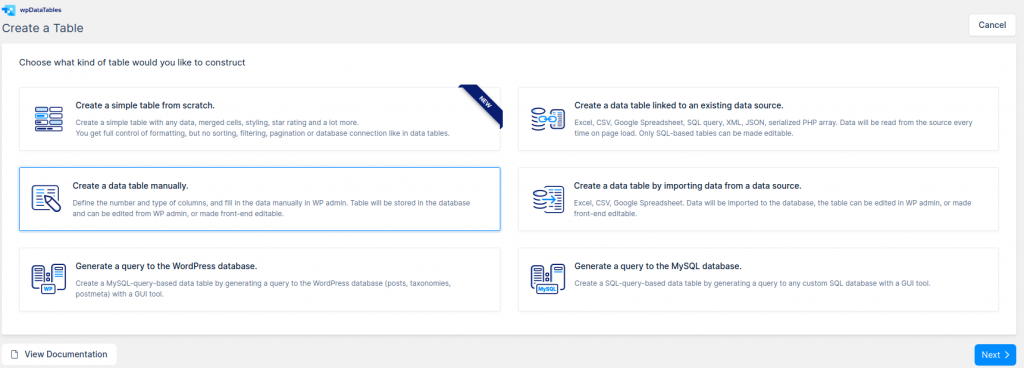
To start creating a data table manually, open your WordPress admin panel, go to wpDataTables -> Create a Table, choose the third option “Create a table manually”, and click “Next“.

You will be shown the wizard step that will assist you to create the table structure where you will create 14 columns: Period, Year, and all other will be names of the months (Jan, Feb…). For Period columns you will leave column type as “One-line string” and for all others, you will set “Integer” column type.
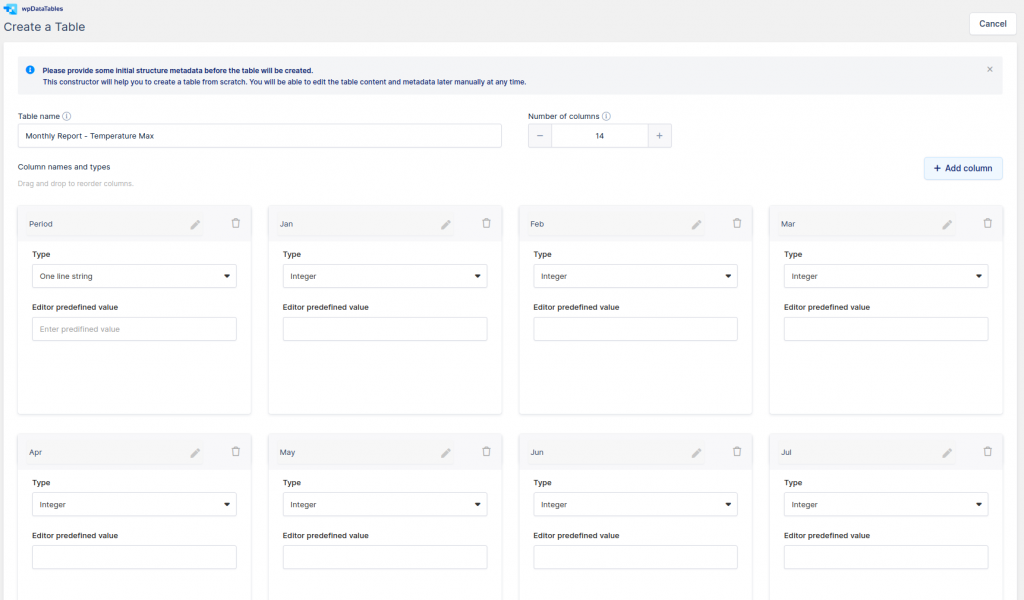
When you have finished configuring the table, click “Create the table”. A dropdown will open with options to “Open in standard editor” or “Open in Excel-like editor” and that’s it. The table structure is created. Now you will insert your data over the Standard editor or an Excel-like editor.
2. Creating a table from a data source
If you have data in some data source like Excel, CSV, JSON, Google spreadsheet, XML, PHP Serialized array, or in a table in the database (SQL source), you will use the second option in the table wizard.
To start creating a data table linked to an existing data source, open your WordPress admin panel, go to wpDataTables -> Create a Table, choose the second option “Create a data table linked to an existing data source.”, and click “Next“.
Depends on which source you have you will follow instructions:
For this table, we use CSV as a data source that you can download from here. You will choose CSV as “Input data source type” and then over the Browse button find that
the source that you previously download and upload on your server. Click Save Changes, so wpDataTables will read the CSV file you uploaded and the table will be created.
After creating the table, with any of the two options, you can customize and configure your WordPress table like you need.
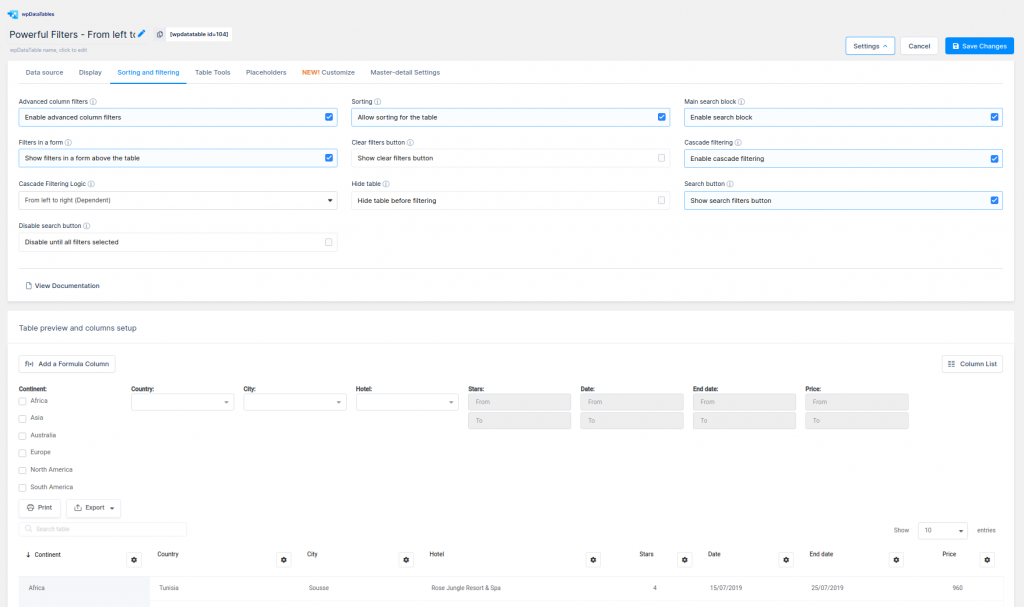
In our case, we first turn on the option “Show filters in a form above the table” on the “Sorting and Filtering” tab in table settings and then configure Advanced filters for each column. For the Period column, we set ‘Select Box filter’ and ‘Number filter’ for all other columns.
Then we turn on the option “Responsiveness” on the “Display” tab in table settings and hide all “Month” columns for tablets and mobile devices in each Column settings or quicker in the Column list button above the table.

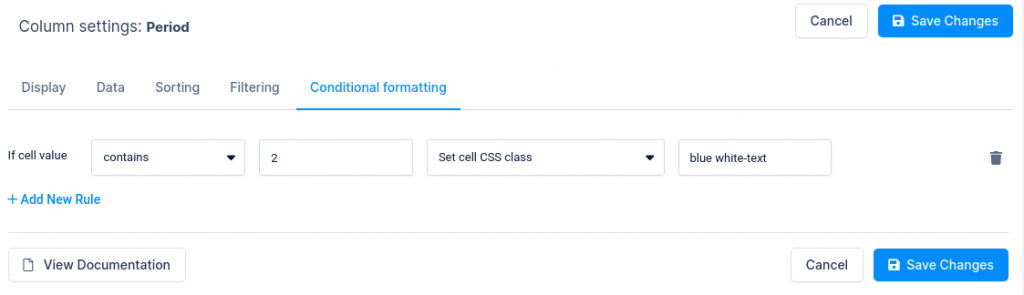
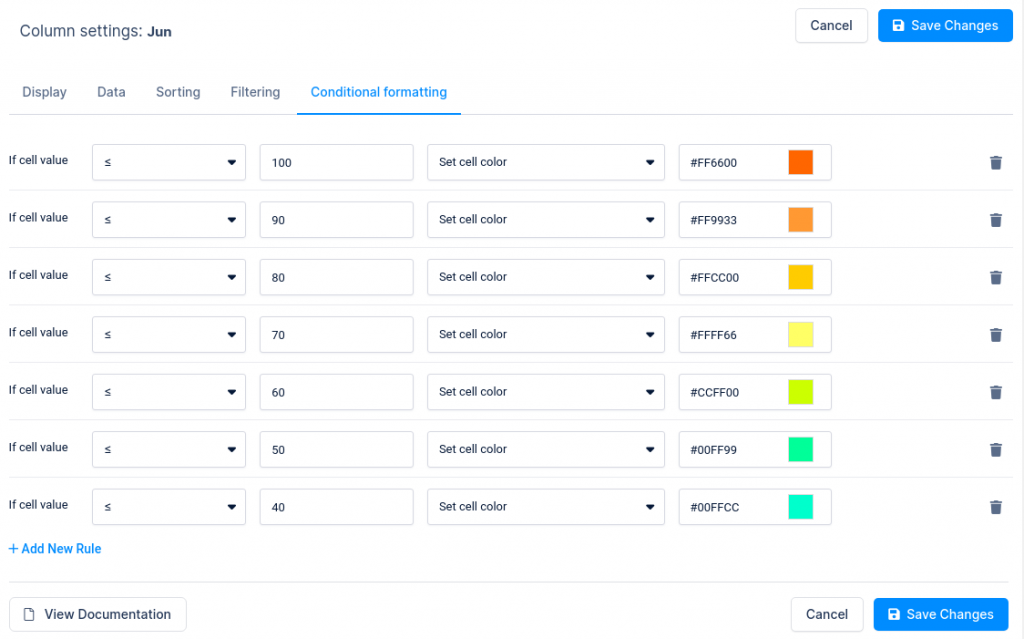
For customizing the table data color we’re using Conditional formatting. For the first column, we set the condition that if the cell contains 2 then “Set cell CSS class” to “blue-white text”.
Then we create those classes on the “Custom CSS” field on the “Customize” tab in table settings like this:
.wpdt-c .wpDataTablesWrapper .wpDataTable-1 td.blue{ background-color: #0083c2 !important;}

.wpdt-c .wpDataTablesWrapper .wpDataTable-1 td.white-text{ color: #FFFFFF !important;}
Like this:
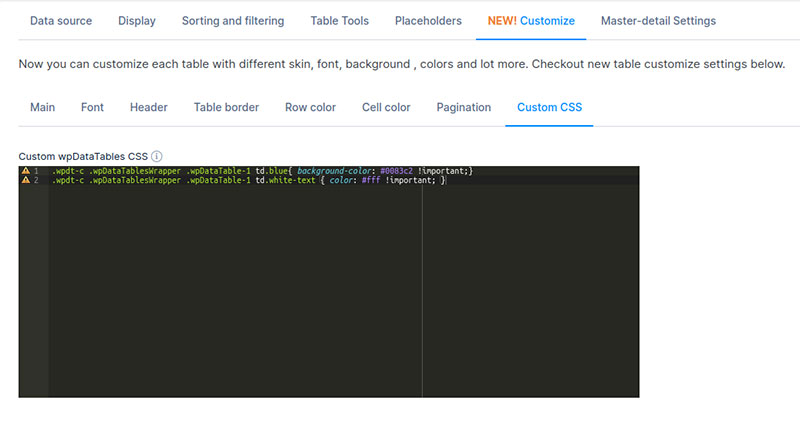
Where number 1 in .wpDataTable-1 is the ID of your table so you will need to change it for your table
For all other columns, we set the same conditions to set different colors based on the value in the table for Max Temperature table.
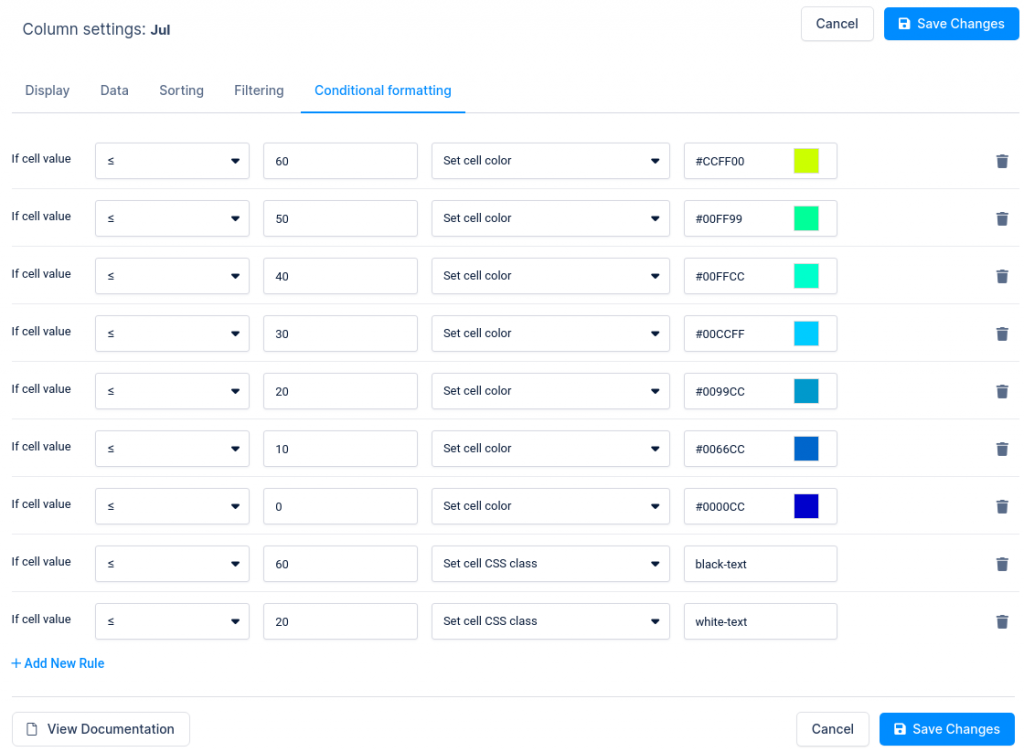
For the second table “Low Temperature” we use the same approach as for the table “Temperature Maximus”, except the conditions in Conditional formatting. Because it is the lower value of the temperature, we use these conditions.
Then we create those classes on the “Custom CSS” field on the “Customize” tab in table settings like this:
.wpdt-c .wpDataTablesWrapper .wpDataTable-2 td.white-text{ color: #FFFFFF !important;}

.wpdt-c .wpDataTablesWrapper .wpDataTable-2 td.black-text{ color: #000000 !important;}
Where number 2 in .wpDataTable2 is the ID of your table so you will need to change it for your table.
That’s it!
Now what you need to do is to show up on your pages in the front-end. As with any other plugin we use shortcodes for showing tables on users’ pages or posts. Adding shortcodes is very easy, especially if you are using popular page builders like Elementor, WP Bakery, or Gutenberg.
Table of Contents
More table styles you can create with wpDataTables
Are you interested in creating more than just weather tables?
You need to have a look at some of the other tables from the showcase section.
Statistics Tables with Charts
wpDataTables is used to generate a graphic representation of statistical data as charts.
Cryptocurrency Rank Table
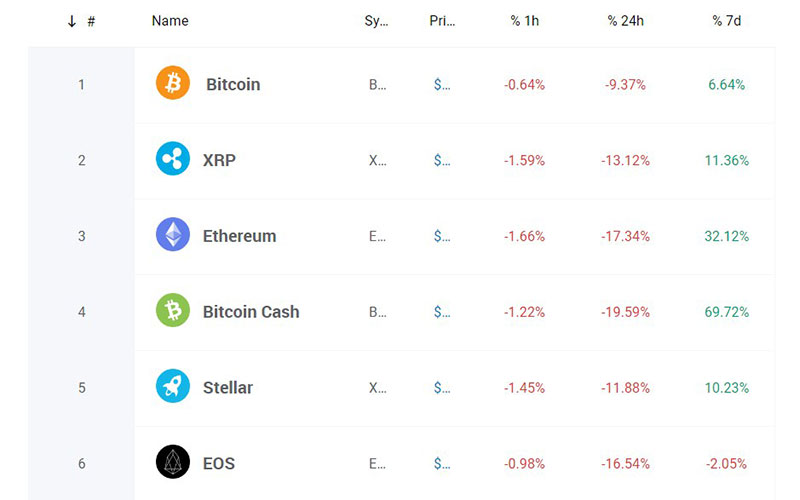
In this example, cryptocurrencies are ranked in a table using wpDataTables. You can add this type of crypto table to your site with a few tweaks.
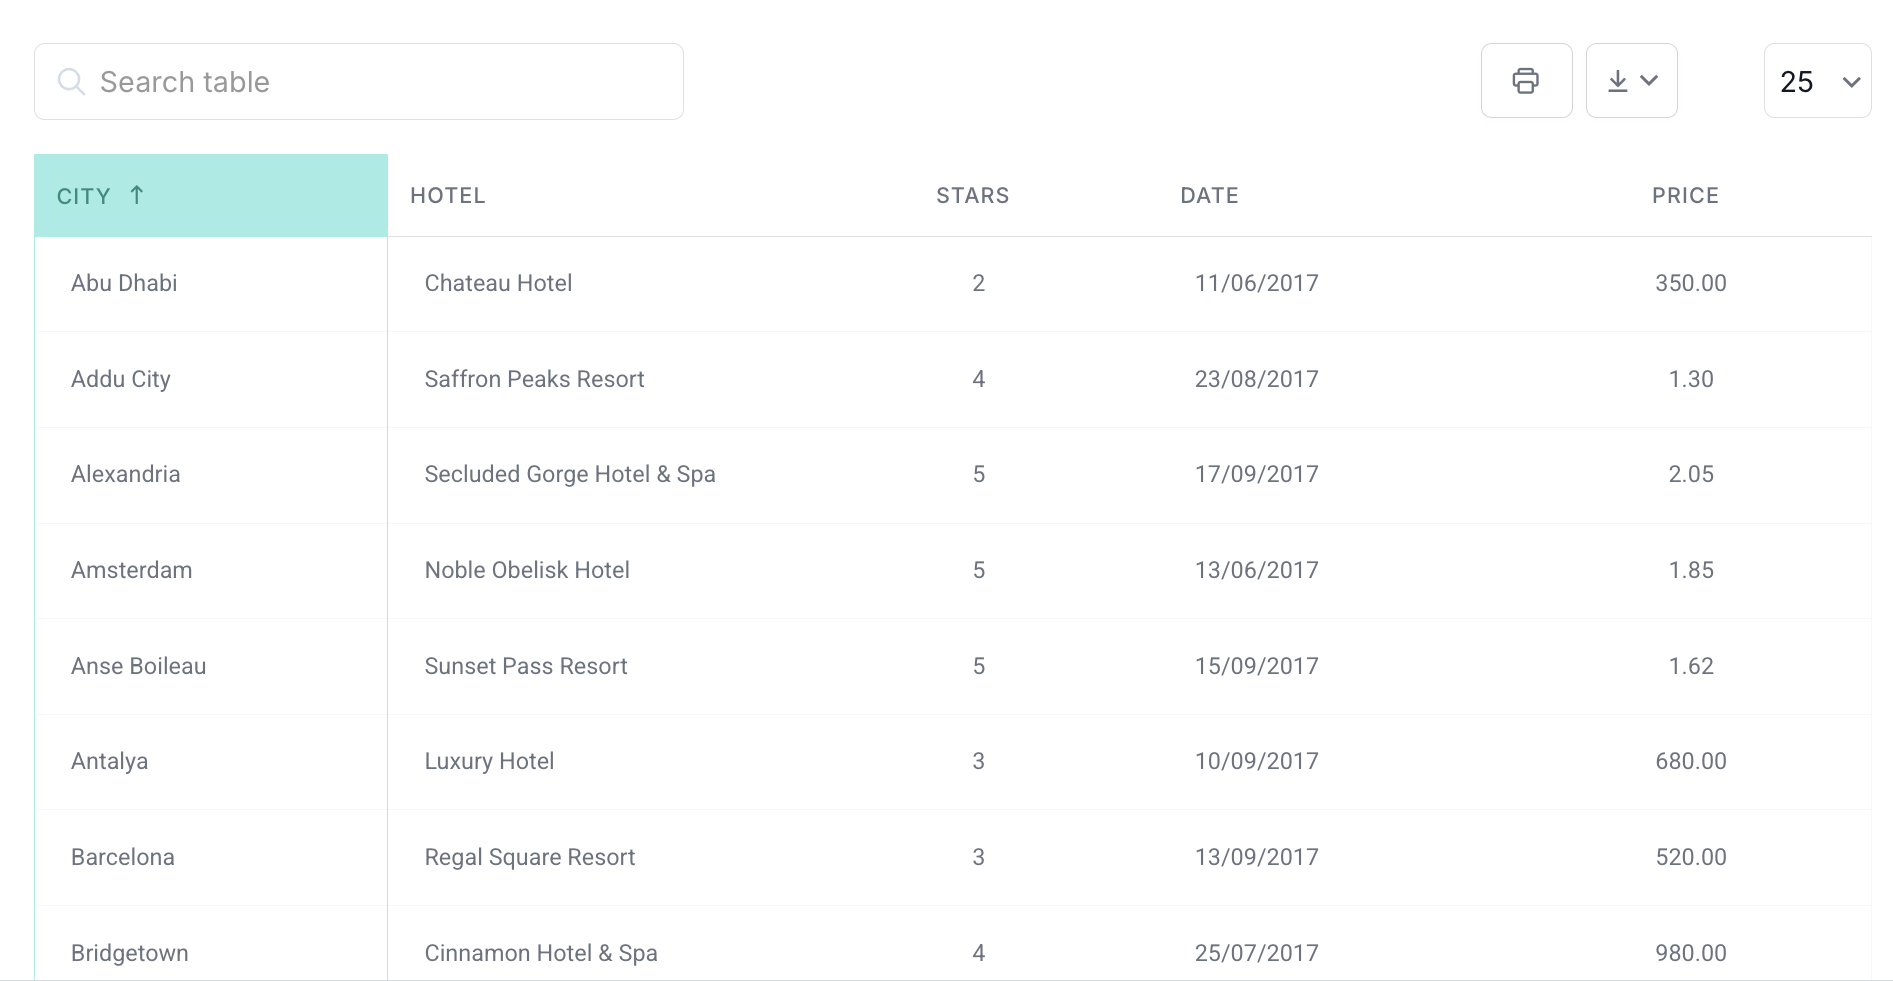
Online Laptop Catalog
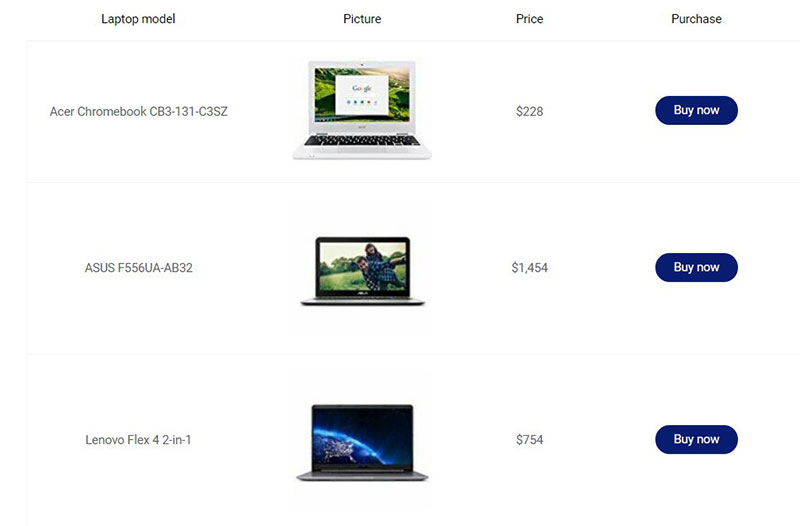
This table can be used for product comparison. For example, if you have a website where you are presenting and promoting products, the table can display the characteristics of the most popular products.
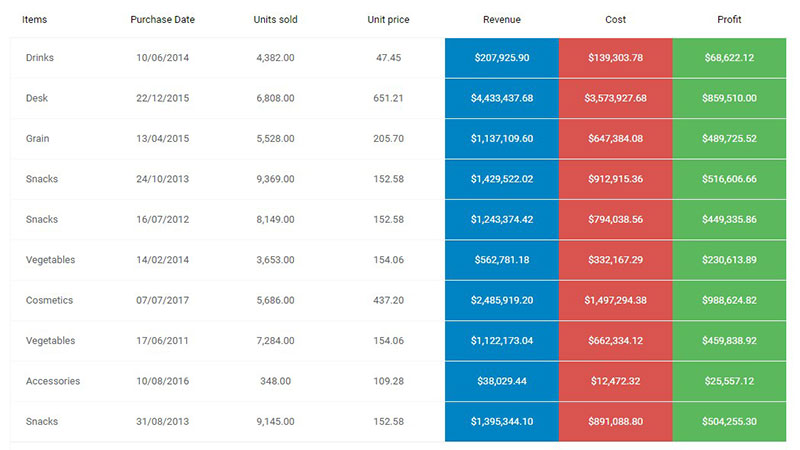
Financial Reports
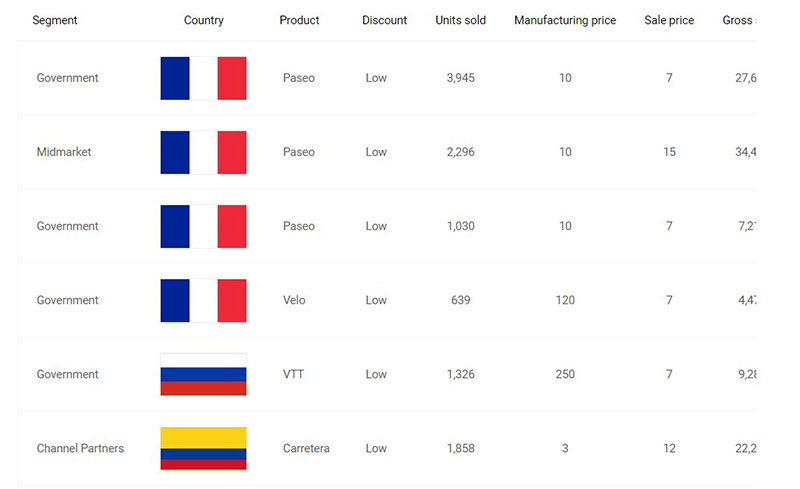
The plugin is used to create a table that shows financial data per country. Obviously, it can be adapted to presenting different types of financial data.
Book Catalog

This table style works well for an affiliate site or an online book store.
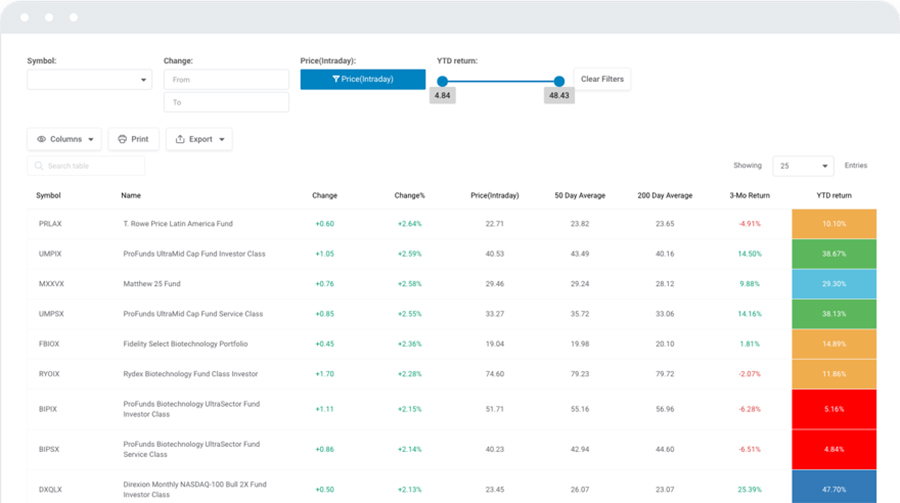
Mutual Funds
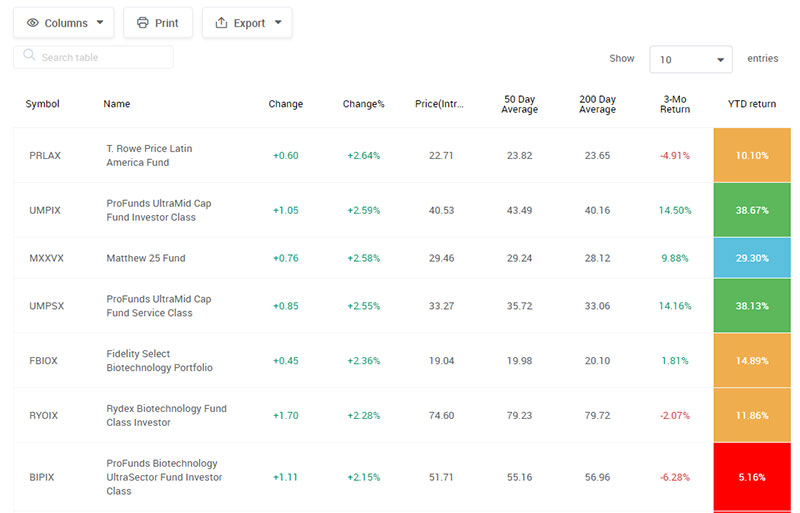
wpDataTables can create a list of mutual funds, sorted by performance.
Catalog of Drivers
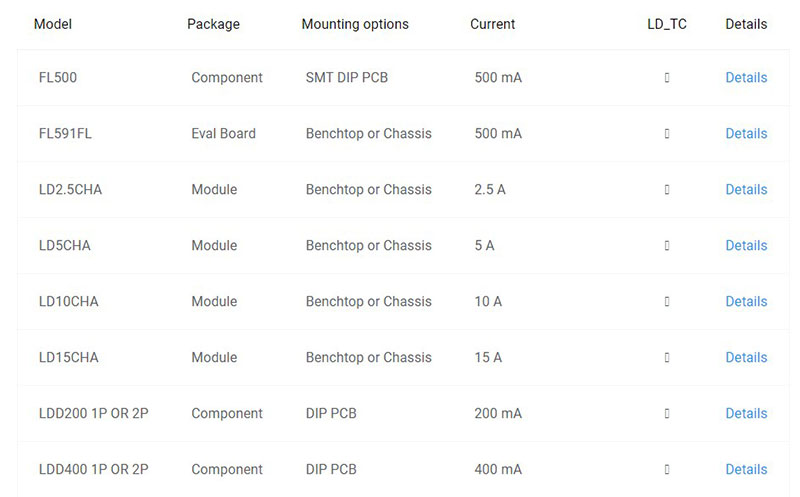
wpDataTables is used to show driver configuration.
Join the wpDataTables Community
If you work with tables, here are some reasons why a wpDataTables license will suit your needs.
- It makes working with tables and charts easy.
- wpDataTables is a global best-selling WordPress table plugin with frequently released updates and great customer support.
- Already more than 40,000 satisfied companies and individuals are using wpDataTables.
- It is used in financial, scientific, statistical, commercial, and other data management applications.
With It, You Can Create Responsive WordPress Tables and Charts
Tables created with the wpDataTables plugin are intrinsic and fully responsive. There is no restriction when it comes to platforms or device types.
You Can Create Large Tables
Large tables are not a problem. wpDataTables handles tables with millions of rows rapidly and reliably. The MySQL server processes all operations.
Advanced Filters and Search Options
Individual filters for your dataset can be developed. This is very useful in narrowing down the data in a WordPress table.
Editability
wpDataTables has the option of making it editable. The content of WordPress tables can thus be edited inline or in a generated form.
Cell Highlighting
Our WordPress tables plugin has a functionality similar to Conditional Formatting in Excel. Depending on their content, you can highlight columns, rows, or individual cells.
Lots of Charts Options
The data in WordPress tables can be used to generate WordPress charts. Three powerful engines are used to generate these charts, which are updated in real-time.
Some Reviews We Received over the Years
wpDataTables successfully solves different tasks for more than 40,000 customers each day. This includes database interaction, business reports, catalogs, scientific dashboards, and many more.
wpDataTables has been a wonderful solution for us! We were already very impressed with the capabilities of the plugin right out of the box. TMS-plugins worked with us to customize it especially for our needs. The customizations allowed us to create an intuitive interface for clients, for input and editing data. Customer support and responsiveness is second to none. wpDataTables is simply a great product.
-Sara Woodmansee, USA. Photographer & Geo Mapping at Geo1 / Aerial Filmworks
From a web developer and a customer perspective, wpDataTables is one of the best plugins I came across. Not only the price is good but also the functionality is perfect. Extremely easy to use and very well designed. It has many features that suit anyone, from beginners to advanced levels. The videos that complement the plugin are in depth well explained with many examples. I can’t emphasize enough how much it made my web development easier and cooler.
– Nordine Benhamari, UK. Web Developer, Database Designer at Thanet Volunteer Bureau
If you liked this article about weather tables, you should check out this article about how to publish an Excel spreadsheet on the web.
There are also similar articles discussing examples of data tables, how to make a data table, pricing table examples, and statistical tables.
And let’s not forget about articles on comparison tables, product comparisons, table UI design, and WordPress Excel spreadsheet plugin.