Imagine you’ve just gathered a goldmine of data. It’s raw, it’s unrefined, and it’s itching to tell a story worth a thousand spreadsheets. But here’s the twist: turning that data into a visual feast is where the real magic happens. Enter the wizards of the web — JavaScript chart libraries.
Think of this: without the flair of charts,
numbers are just… numbers.
As if your data donned its Sunday best, JavaScript chart libraries transform those sleepy digits into dynamic, interactive narratives. Easy to digest, and, dare I say, fun to explore.
From effortless bar graphs to sophisticated data-driven documents, you’ll discover the tools to not just present data but to truly exhibit it. By the end of this scroll-through, you’ll be the curator of your own digital museum, showcasing data in ways that engage, inform, and inspire action.
So, get ready to:
- Dive into the anatomy of Highcharts and Chart.js.
- Uncover the superpowers of D3.js for that extra pizzazz.
- Learn the secrets of responsive design for charts that look sharp on any device.
Your mission: to wield these libraries like a pro. Let’s light up those charts! 🌟
Table of Contents
15 Superior JavaScript Chart Libraries for Web Development
| Library | Licensing | Chart Types | Interactivity | Ease of Use | Data Manipulation |
|---|---|---|---|---|---|
| D3.js | Open Source (BSD) | Highly Customizable | Advanced | Complex | Advanced |
| FusionCharts | Commercial/Free Trial | Extensive Range | Advanced | Easy | Built-in |
| Google Charts | Free | Wide Selection | Basic to Advanced | Easy | Built-in |
| CanvasJS | Commercial/Free Trial | Wide Selection | Basic to Advanced | Easy | Basic |
| C3.js | Open Source (MIT) | Customizable, D3-based | Basic to Advanced | Moderate | Intermediate (D3) |
| Dygraphs | Open Source (MIT) | Time Series | Basic | Moderate | Basic |
| ApexCharts.js | Open Source (MIT) | Modern, Interactive | Advanced | Easy | Basic |
| ZingChart | Commercial/Free Tier | Extensive Range | Advanced | Moderate | Built-in |
| NVD3 | Open Source (MIT) | D3-based, Pre-defined | Basic to Advanced | Moderate | Intermediate (D3) |
| Chart.js | Open Source (MIT) | Basic to Complex | Basic to Advanced | Easy | Basic |
| Chartist.js | Open Source (MIT) | Responsive, Simple Charts | Basic | Moderate | Limited |
| Billboard.js | Open Source (MIT) | D3-based, Easy to Use | Basic to Advanced | Easy | Intermediate (D3) |
| Frappe Charts | Open Source (MIT) | SVG, Simple Bar/Line/Pie | Basic | Easy | Basic |
| Highcharts | Commercial/Free (Non-commercial) | Extensive Range | Advanced | Easy | Built-in |
| Sigma Charts | Open Source (MIT) | Graphs, Networks | Advanced (Graph-specific) | Complex | Advanced (Graphs) |
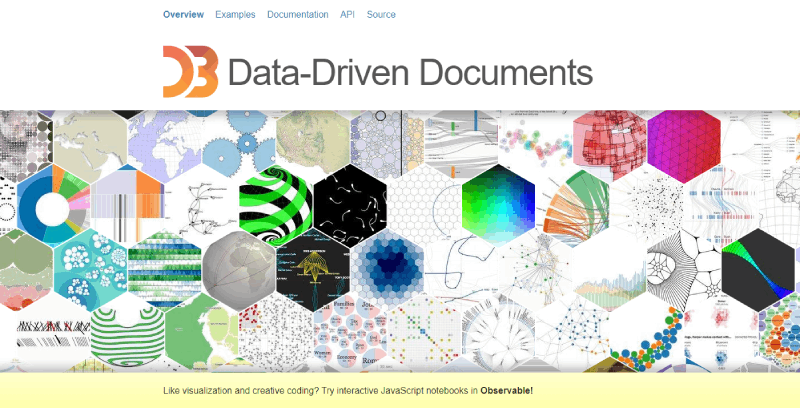
D3.js
Perhaps one of the more well-known JavaScript charting libraries on the list, D3.js is for data visualization, analysis, and utilities, as well as geo and animation. It boasts a vast API and uses HTML, SVG, and CSS.
D3.js can likely help with a range of functionality needs, but there are a few drawbacks. The learning curve is challenging and takes time, and the comprehensive documentation is dated and difficult to follow.
Attributes:
- support for several chart types
- a data-driven method in relation to DOM manipulation merged with elegant visualization components
- a straightforward in-browser element inspector for debugging
- loads of accessible samples
- curve-generating functions
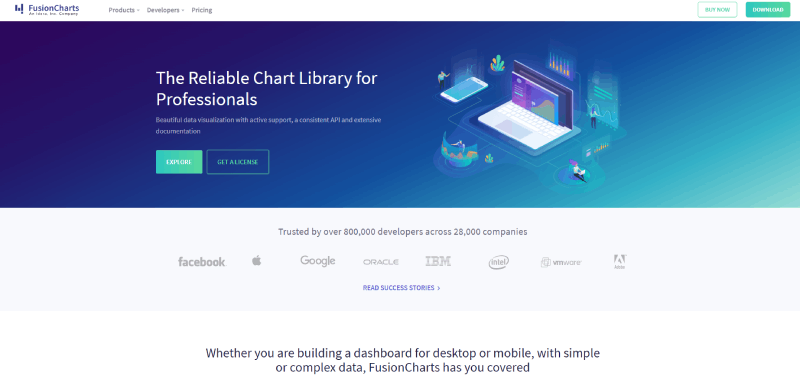
FusionCharts
This is the most comprehensive JavaScript charting library out there featuring over 90 chart options and 900 maps ready for use. FushionCharts boasts the most eye-catching charts. Their powerful reporting experience via dashboards—offering a panoramic view of every business task.
This chart library works well with PCs, Macs, iPhones, and Android tablets. And it exceeds expectations by ensuring cross-browser compatibility (including IE6).
Attributes:
- various 2D and 3D chart options
- full interactive animated charts and maps
- NET, PHP, and Ruby on Rails server-side APIs
- support for jQuery, Angular, PHP, ASP.NET, React Native, Django, React, Ruby on Rails, Java, and more
- detailed user’s handbook and API reference
- various samples and dashboards to check out
- support for older browsers
Plotly
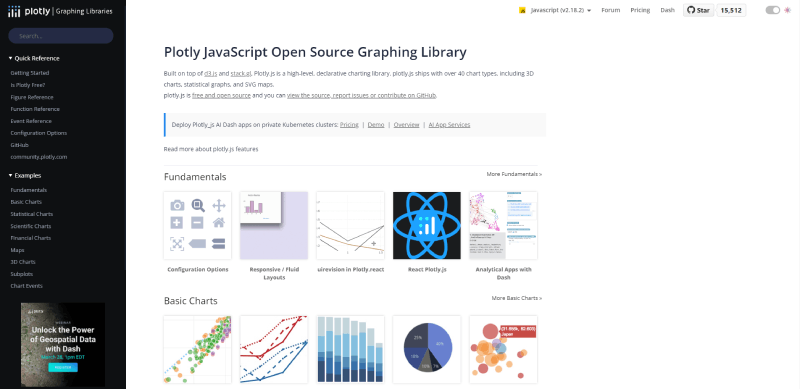
The web’s first scientific and open source JavaScript library is available for free. Plotly provides support for 20 chart types (SVG maps, 3D charts, statistical graphs). It’s stacked on D3.js and stack.gl.
Plotly has an extensive library with exceptional documentation and tutorials for all chart types.
The charts and graphs are professional, and the simple setup involves entering the dynamic data and customizing the layout, notes, axes, and legend.
Attributes:
- 3D charts
- SVG maps
- statistical graphs
- built onto D3.js and stack.gl
- 20 chart options
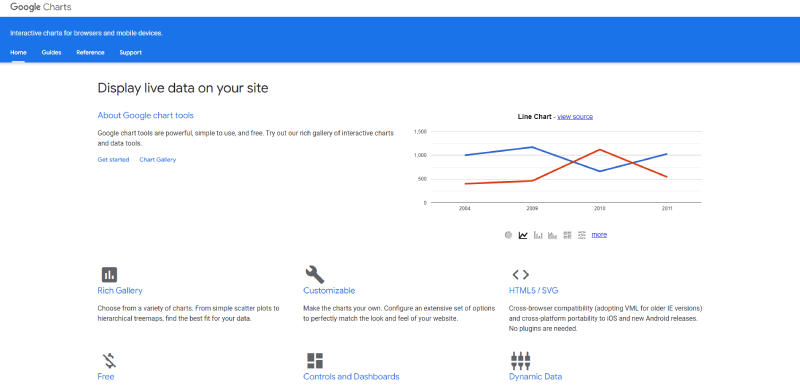
Google Charts
Google Charts is perfect for basic projects involving no complicated customization. Choose from a variety of pre-designed charts: area charts, bar charts, calendar charts, pie charts, geo charts, etc. Instantly upload these interactive charts onto a site.
Change chart appearances with customization options, and render charts using HTML5/SVG. Google Charts is compatible across platforms and browsers, including iPhones, iPads, and Android. Google Charts supports older IE versions via VML.
Attributes:
- a considerable amount of chart types
- customization options
- interactive components
- real-time data
- ease of use
- straightforward integration
- open-source JavaScript library
Did I mention that wpDataTables uses Google Charts?
Let me tell you about wpDataTables, a game-changer for all you data enthusiasts out there. This amazing tool uses Google Charts – you know, one of the best charting libraries out there – to create some seriously stunning visuals.

So, here’s what you can expect from this powerful duo:
- Ease of use: Seriously, you don’t need to be a coding genius to create impressive charts. wpDataTables makes it super simple to bring your data to life. 🧙♂️
- Customization: Tired of generic-looking charts? Not anymore! With wpDataTables and Google Charts, you can tweak colors, fonts, and layouts to match your unique style.
- Interactive: Users can play around with the data, making it a fun and engaging experience for everyone.
- Responsive: Mobile, tablet, or desktop – wpDataTables got you covered! Your charts will look perfect on any device. 📱💻
- Integration: Use your favorite data sources, like Google Sheets or Excel, and watch the magic happen!
But wait, there’s more:
- Huge variety of chart types (Pie, Bar, Line, you name it!)
- Automatic updates: Keep your data fresh without lifting a finger
- Export options: Need to share your awesome chart? No problem, just save it as an image or a PDF!
Give wpDataTables and Google Charts a try, and you’ll wonder how you ever lived without them. Trust me, your data game is about to level up!
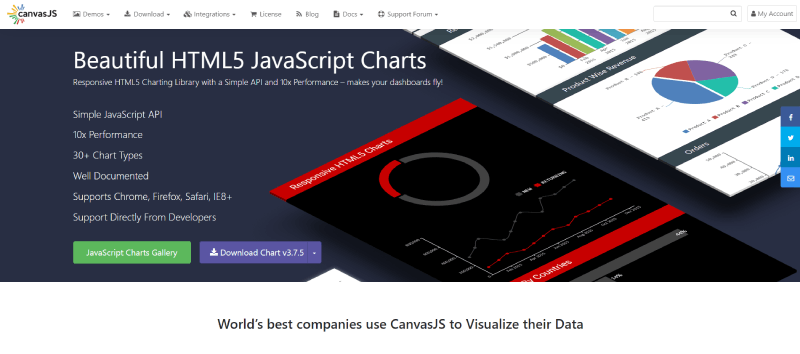
CanvasJS
Here is a multipurpose, quick and straightforward JS chart solution with up to 30 chart options to pick from. CanvasJS allows you to customize charts and offers support for animation and mixed charts. Create a vibrant chart theme in the UI.
CanvasJS provides support for JavaScript front-end frameworks and chart rendering in server-side technologies (PHP, ASP.NET, MVC stacks). It helps bypass problems in documents for a variety of situations.
The library incorporates a dashboard tool, offering a variety of perspectives from which to visualize data. Use CanvasJS to plot stock-related charts, and use different CDNs for stock and general charts.
Attributes:
- assortment of chart types
- customization options
- interactive components
- real-time data
- responsiveness
- cross-platform compatibility
- multi-lingual support
- free and commercial licenses
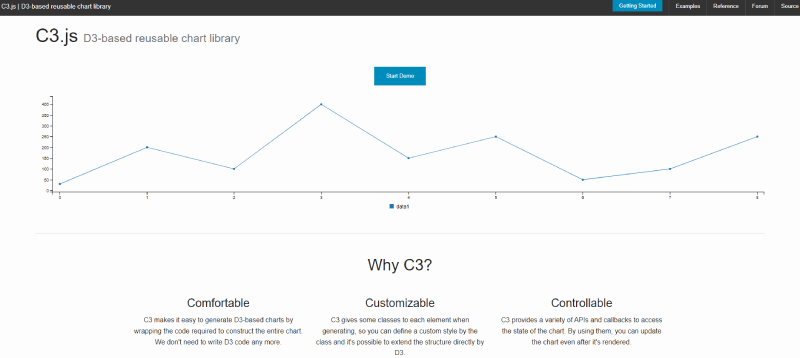
C3.js
C3.js is an effective D3-based data visualization library. It renders quickly, features strong compatibility with various browsers, and basic integration, making it a hassle-free option.
Its straightforward library comes with coherent documentation, which is a bonus.
The functionality lacks a little and does not boast as many features as other top-notch libraries. The visualizations are simplistic, so if you are looking to win awards for your chart designs, this isn’t the best JS chart solution. But it is practical and clear to use.
A get-started guide directs you as you set up your project using the basic library.
Attributes:
- wide range of tutorials and documentation
- responsive and mobile-friendly
- able to filter data series
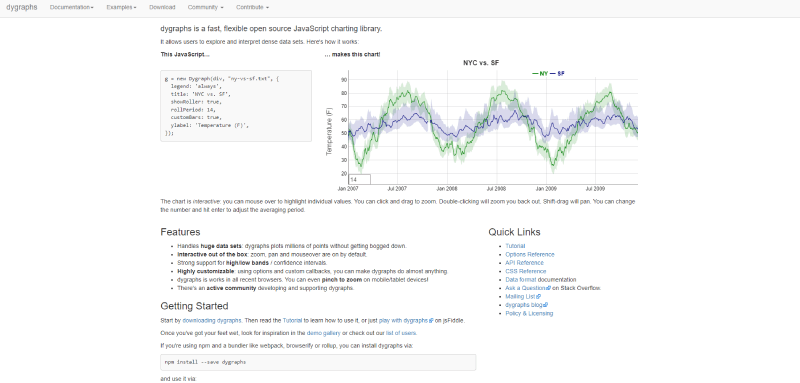
Dygraphs
This is one of the fastest chart-rendering libraries out there. It operates smoothly with a substantial volume of data, and data analysts can work with extensive datasets (tens of thousands).
Attributes:
- ability to synchronize multiple charts
- customizable annotations with the Range/Viewfinder
- straightforward from the start
- perfect for showing data in real-time
- rapid data point feedback which is displayed off-chart
- zoom in and out function
- various samples featuring links to JSFiddles
- easy data manipulation using basic arrays or load data from text or CSV files
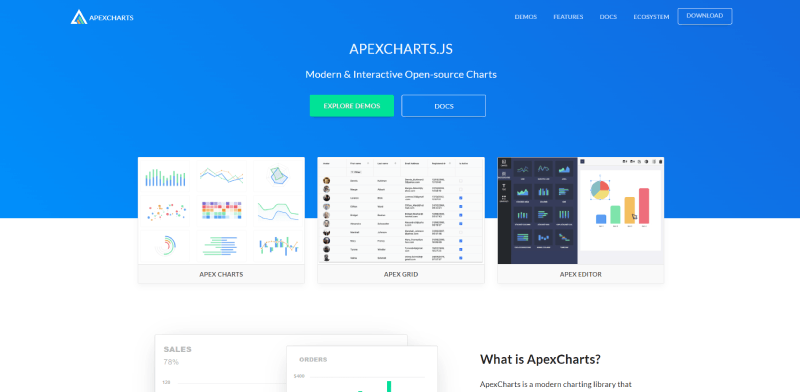
ApexCharts.Js
Here is a contemporary and practical open source chart library for creators to build eye-catching interactive visualizations. ApexCharts.Js is an MIT-licensed and open source library.
You can change and load datasets using sleek interactive animation and choose from over 10 color palettes to create a pre-set theme. Clear documentation helps you to get going as soon as possible.
It’s no wonder ApexCharts is popular among web developers boasting over 1 million downloads a month—no registration needed to download.
Attributes:
- various chart options
- fully responsive
- extremely interactive
- over 100 samples to inspire
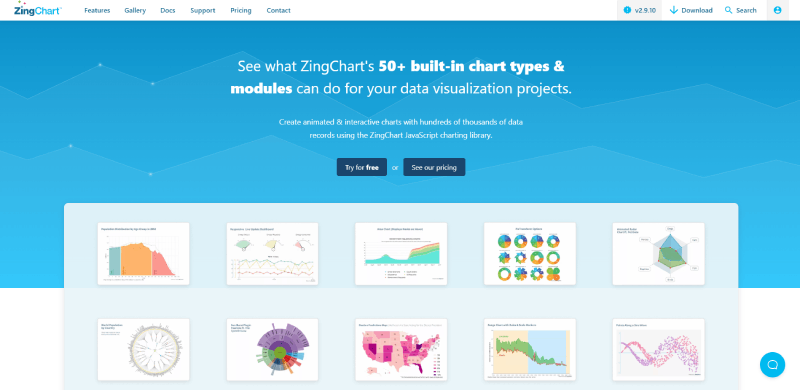
ZingChart
Apple, Microsoft, Adobe, Boeing and Cisco all use ZingChart—an adaptable, interactive, and up-to-date JavaScript charting library. It uses HTML5, Ajax, and JSON to design captivating charts.
ZingChart provides over 35 chart types and modules with real-time display. Use CSS to develop the design and theme of the chart and render big data quickly.
Check out all chart types for free or purchase a watermark-free license according to your business needs.
Attributes:
- assorted chart types
- customization options
- mobile-responsive
- integrates with various web frameworks and libraries (Angular, React, jQuery, and Vue)
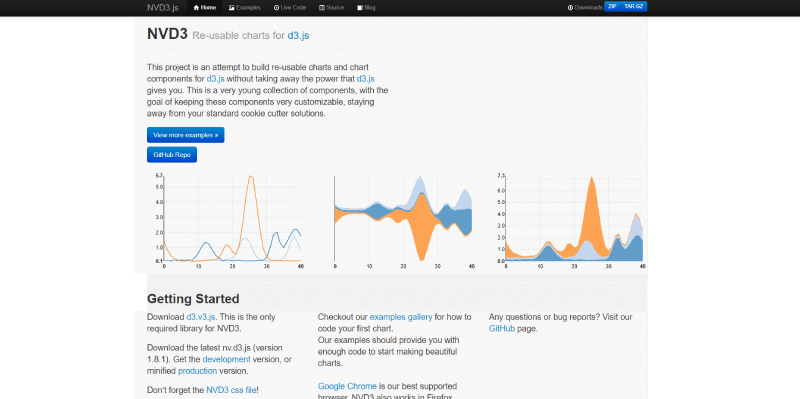
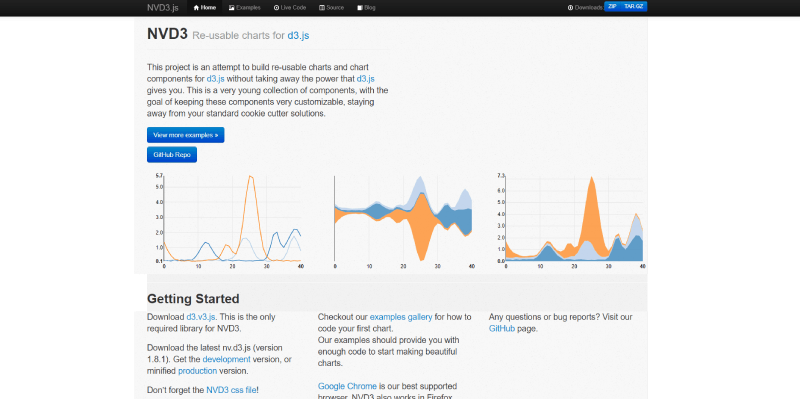
NVD3
Another popular chart library, NVD3 is built on top of D3.js and features a robust technical foundation.
Performance is pretty solid, and simple animations give some life into the visual aspect of the basic interface. NVD3 easily integrates with existing data API solutions so you can add data straight from .json files.
In comparison with other JavaScript chart libraries, this one is more limited, but the most common graph options are accessible.
The Apache 2.0 License makes this a totally open source JavaScript chart library.
Attributes:
- interactive charts
- various chart types
- responsive
- customization of themes
- tooltips
Chart.js
Chart.is has a well-known and much-loved chart library with over 55 thousand stars to its name on GitHub. Create responsive charts with HTML5 Canvas elements with this light charting library.
You have access to six unique default chart types which are responsive and easy to work with (especially for tech newbies). Chart.js is a fascinating open source library to explore.
Attributes:
- modify and animate each chart type
- responsive charts online
- use plugins to enhance system functionality
- excellent documentation
- majority of browsers support IE9+
Chartist.js
An SVG-based chart library, featuring SVG animations within the charts), Chartist.js is a free-use JavaScript chart library with a robust technological foundation. And creating your project is quick and easy.
Instantly create a striking chart that engages simply with any backend data source. Make use of Sass for easy configuration and change this chart library.
Attributes:
- incredible animation
- API documentation contains vital information but is difficult to navigate (a lot of scrolling)
- increase functionality via plugins
- design charts with SVG
- offers support for older browsers
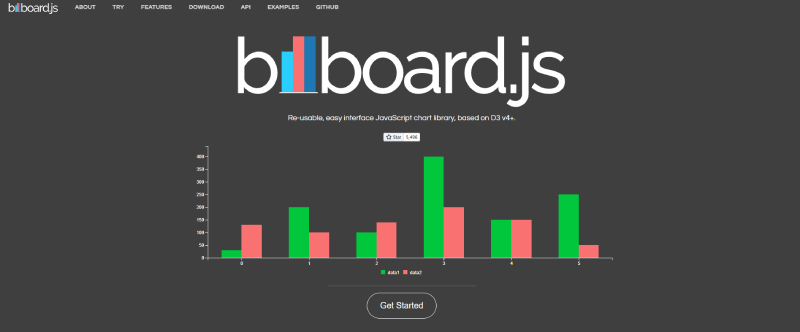
Billboard.Js
Billboard is founded on D3 v4+ and is a free, straightforward charting library. It features 22 chart types and its demo section has over 220 examples to draw from. Each detailed feature and sample have an API document to assist you to get going with your project.
Entering data is simple, enabling you to add small or large datasets for your visualizations.
Attributes:
- create charts with ease
- ESM (ES Module) with ES6+ syntax
- a variety of practical and comprehensive options
- compatible with D3 v4+
Frappe Charts
Frappe Charts is one of those basic JavaScript chart libraries with minimal constraints. There are only 17 contributors assisting on this open-source visualization library, setting it apart as one of the smallest chart libraries featured in this article. It’s built on top of Chart.js and delivers a variety of bonus features.
Inspired by GitHub’s visualizations, Frappe Charts supports an array of charts, from line graphs and bar charts to pie charts. Use this charting library to design heat maps reminiscent of those found on GitHub Activity. Frappe Chart is the JS library for you if you’re looking for minimalistic and light use.
Attributes:
- uncomplicated and user-friendly
- an assortment of available chart types
- customization options
- interactive
- mobile-responsive
- light functionality
Highcharts
Highcharts is jam-packed with an assortment of standout animation formats that are effective enough to draw a great deal of visitors to your official website—and keep them engaged.
As with the other libraries mentioned here, Highcharts includes a range of pre-designed graphs, for example area charts, area spline graphs, column, bar and pie charts, as well as scatter and spline visualizations. All the charts created are responsive and mobile-friendly. It also boasts some advanced features, like the addition of annotations (commentary) to various charts.
A huge draw for Highcharts is its ability to remain compatible with browsers, going so far back as Internet Explorer 6. A conventional browser would render graphics using an SVG format, but the legacy Internet Explorer browser uses VML to construct graphics.
Wrappers are available for the more widely used languages (.NET, PHP, Python, R, and Java), for frameworks like Angular, React and Vue, and for Android and iOS systems.
Highcharts is free for personal use but commercial purposes require a paid user license.
Attributes:
- optimized to cater for responsive design elements and touch-screen devices
- efficient enough to handle big data
- speedy on-hover tooltips rendering
- capable of annotating graphs and charts
- load data straight on to charts via a CSV file
Sigma Charts
Sigma Charts is a JavaScript library built on WebGL and Canvas with a public API. It encompasses a considerable amount of plugins from the GitHub community. This chart library also boasts complete responsiveness and touch interactivity. Developers can add their unique functions straight to the scripts and render nodes and edges according to precise specs.
Sigma Charts facilitates a great deal of various settings for easily customizable design and interplay with networks. This JavaScript charting library is a rendering engine powerhouse, so you can add as much interactivity as you need. You can also adjust data, shift the camera, refresh the rendering or listen to events via the public API.
If you are a developer on the lookout for a robust drawing tool that delivers in performance, then Sigma Charts is just for you.
Some standout attributes include:
- high-performance rendering
- great interactivity and customization possibilities
- an assortment of layouts to pick from
- extensible and modular
- vivid data visualization
FAQs on JavaScript Chart Libraries
What’s the best way to get started with JavaScript chart libraries?
Let’s jump right in. Think about what story your data is itching to tell. Pick a library—Chart.js is like a good coffee, strong and straightforward for newbies. Just check their docs, grab some sample code, and tweak to fit your narrative. It’s all about playing with examples.
Can I use these libraries for commercial projects?
Absolutely, but keep it on the straight. Most libraries, like Highcharts or ECharts, offer free versions for personal use. But if you’re doing the corporate dance, you’ll need a license. Check their sites, grab a license if needed, and you’re golden to go commercial.
How do JavaScript chart libraries handle large data sets?
Hey, large data’s no sweat for these tools. Libraries like D3.js chew through big numbers for breakfast. But here’s the deal: efficiency matters. Streamline your data, maybe pre-process on the server side, and let the library do the heavy lifting client-side. It’s all about smart data handling.
Are charts created with these libraries mobile-responsive?
You bet they are. But remember, it’s not magic. You’ll still need to nudge things around with settings. Tools like ApexCharts or CanvasJS often have responsive configs right out of the box—use them! Ensure your data dazzles on devices from phones to phablets.
What kind of charts can I create with these libraries?
Oh, the variety—it’s like a candy store for data visualization. From your classic bars and pies to trendy radar and scatter plots. Each tool, think Plotly.js or amCharts, packs its own special punch. Explore their galleries and let your creativity go wild with chart types.
How steep is the learning curve for these libraries?
Look, here’s the scoop—some are a walk in the park, others, more like climbing a mountain. Chart.js? A brisk walk. D3.js? Grab your climbing gear. But don’t sweat it, plenty of tutorials and communities are out there ready to give you a boost.
Can I customize the appearance of the charts?
Customization’s the name of the game! Want chart colors that pop? Fancy custom tooltips? These libraries give you the paintbrush—Highcharts, in particular, is all about that visual flair. Dive into the docs and style your charts to match the vibe you’re going for.
Is it difficult to integrate these libraries with frameworks like React or Vue?
Chill, integrating’s not the beast it’s made out to be. Most popular libraries play nice with the cool kids—React, Vue, Angular—you name it. Some even offer wrappers or dedicated versions. Check for guides specific to your framework and you’ll have those charts and graphs cozying up to your components in no time.
What are the benefits of using JavaScript libraries over native HTML5 canvas for charting?
Here’s the deal: canvas is low-level, you’ve got to drive manual. JavaScript libraries? They’re like having an autopilot. They handle the nitty-gritty—rendering, interactions, animations—so you can focus on the bigger picture. Utilize their API and get that cross-browser compatibility and high-level abstraction as a sweet bonus.
How do I handle interactivity and events in charts?
Interactivity’s what brings your charts to life, right? Most libraries have you covered. Hook into event listeners, jazz up your charts with click, hover, or zoom features. Need to drill down into that bar chart? No problem. It’s all about making your charts as interactive as a game—attract, engage, and inform.
Conclusion on These JS chart libraries
So we’ve been chatting about JavaScript chart libraries, and you’ve gotta admit, it’s kind of like uncovering a secret universe where data sings and dances. From the straightforward simplicity of Chart.js to the deep dives with D3.js, we’ve journeyed through the galaxy of graphing.
But what’s the takeaway?
It’s like this:
- Your data’s got stories to tell, and it needs the right stage. These libraries? They’re your backstage crew, setting the spotlight.
- Whether you’re in for data visualization on a cosmic scale or just a simple pie to share with your team, you’ve got the tools.
- And hey, when it comes to the nuts and bolts – customization, interactivity, mobile-friendly vibes – you’re covered. These libraries are like a Swiss Army knife for your data display woes.
Bottom line: don’t let your data collect dust. Unleash it. Let it loose. Make it sing. Because, in the end, those charts you create are more than just pretty pictures—they’re your data’s wildest dreams made visible.
If you liked this article about JavaScript chart libraries, you should check out this article about financial charts and graphs.
There are also similar articles discussing interactive charts, creating interactive charts, comparison chart makers, and comparison charts.
And let’s not forget about articles on React chart libraries, chart generators, examples of good graphs, and animated charts.
