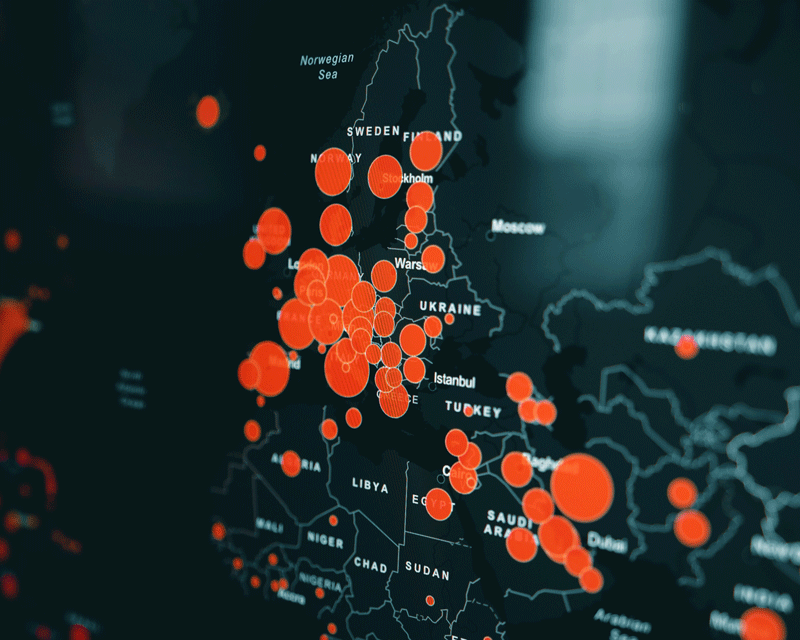
The Best Looking Chart Designs From User Interfaces
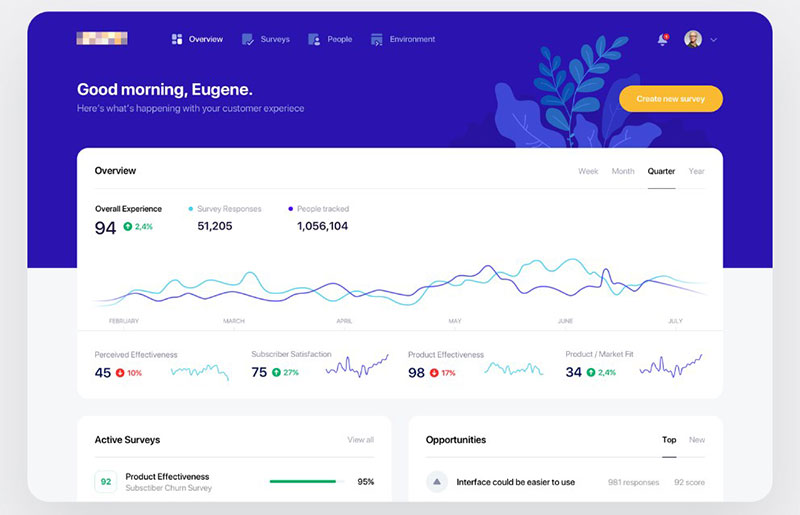
You’re staring at an ocean of data—a potential gold mine of insights—yet it’s as if a fog rolls in, obscuring the treasure beneath. Your lifesaver? Chart designs from user interfaces. They’re the beacon of clarity that slice through the mist,…