Highcharts is free for personal projects and paid the moment the work turns commercial. That one line in the license is what sends most teams looking elsewhere.
Which is a shame, because the reach is real. BuiltWith data from October 2025 lists it as the most-used technology in the charting category, with 62.150 detections across the top 1 million sites.
So the search starts: something free, or something that scales past SVG limits, or something that drops cleanly into React.
If you’re on WordPress, there’s a shortcut worth knowing about up front. wpDataTables already bundles Highcharts alongside Chart.js, Google Charts, and ApexCharts, so switching engines takes no code at all.
Table of Contents
What Is Highcharts?
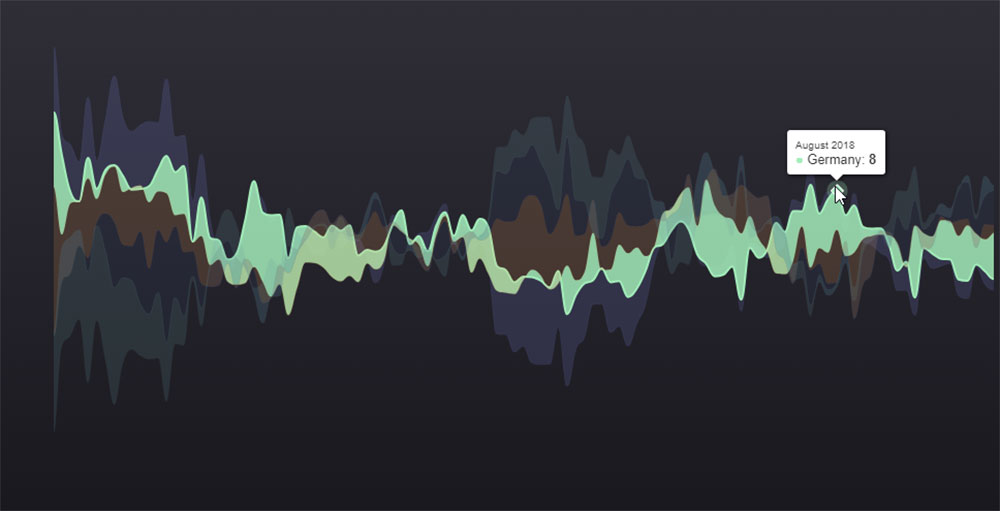
It’s an SVG-based JavaScript charting library for building interactive charts on websites and web apps. The product family covers Highcharts Core, Highcharts Stock, Highcharts Maps, and Highcharts Gantt.
The library renders through SVG. Older versions carried VML and canvas fallbacks for legacy browsers, though modern releases have dropped legacy Internet Explorer support.
On licensing, it’s free for personal and non-commercial projects, paid for commercial use. Inside WordPress there’s an exception: wpDataTables bundles the Highcharts engine, and since plugin version 3.0.4 that bundled library is free for commercial use.
Amazon, Walmart, and Apple all show Highcharts in their stacks, according to Datanyze.
Why Do Developers Look for Highcharts Alternatives?
Four things push teams off it, and the first one is usually money:
- License cost. A paid seat is required the moment a project turns commercial
- SVG scaling ceiling. Rendering slows past roughly 100,000 points, a known limit when plotting very large data sets
- No native 3D. There’s no GPU-accelerated 3D surface or scatter rendering
- Framework friction. Teams wanting drop-in components often prefer libraries with first-party wrappers
Inside WordPress, the license question mostly disappears, since wpDataTables ships Highcharts free for commercial use.
Asset and wealth management firms rank among the heaviest Highcharts users (6sense), which is why Highcharts Stock and financial data visualization stay central to the product.
What Makes a Strong Highcharts Alternative?
Match it on chart-type range, rendering method, license terms, framework support, and dataset ceiling. For WordPress users, no-code chart building matters more than raw API access.
What to weigh when you compare JavaScript chart libraries side by side:
- Rendering engine: SVG, Canvas, or WebGL, which sets the dataset limit
- License: MIT and open-source versus a commercial quote
- Chart types, including stock and OHLC support
- Framework wrappers and TypeScript typings
- No-code availability for non-developers
SVG libraries share the same performance floor, so the rendering engine predicts the ceiling better than any feature list does.
Which Free and Open-Source Libraries Replace Highcharts?
Chart.js, ApexCharts, Apache ECharts, D3.js, Plotly.js, Recharts, and Google Charts cover most Highcharts use cases between them. Three of those (Chart.js, Google Charts, ApexCharts) ship inside wpDataTables as built-in engines.
The quick view before the detail, which doubles as a map for anyone weighing open-source data visualization options:
| Library | Rendering | Best For |
|---|---|---|
| Chart.js | Canvas |
Simple dashboards |
| ApexCharts | SVG |
Polished React/Vue |
| Apache ECharts | Canvas |
Large datasets |
| D3.js | SVG |
Custom visuals |
Chart.js
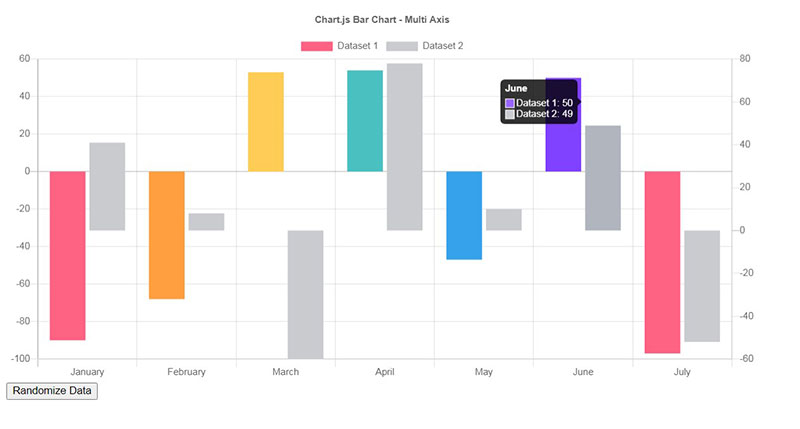
Canvas rendering, MIT license, and enormous reach. Chart.js 4.5.x pulls roughly 12 million weekly npm downloads and about 67,500 GitHub stars.
wpDataTables runs Chart.js as a native engine, currently on the v4.x line.
ApexCharts
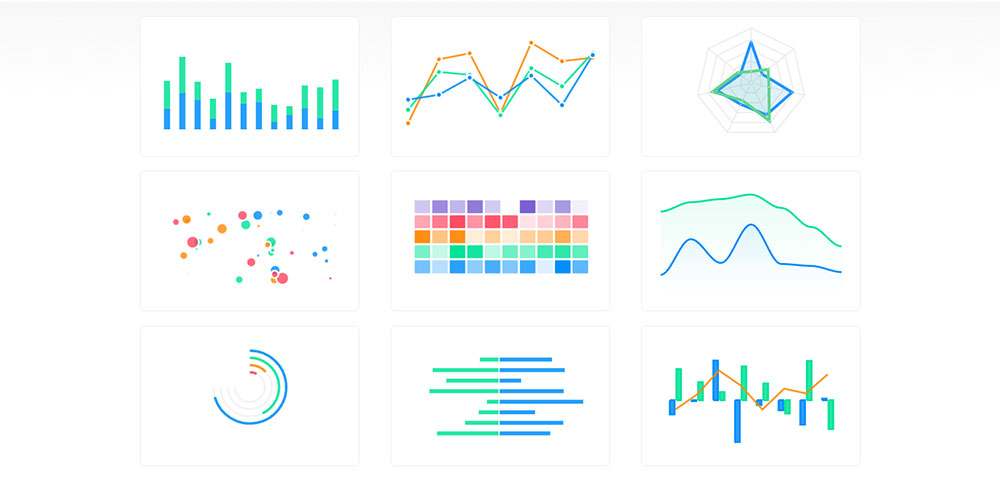
SVG rendering with attractive defaults and strong framework wrappers. It also sits inside wpDataTables as the ApexCharts engine.
- Official React, Vue, and Angular wrappers
- Solid TypeScript support since v3
- Around 15,000 GitHub stars
Apache ECharts
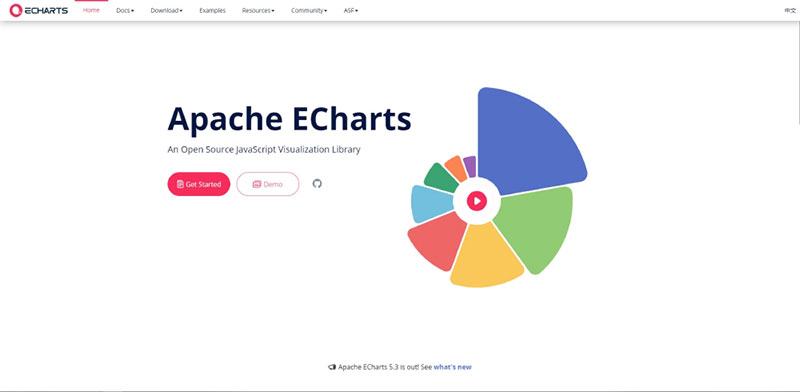
ECharts 6.x draws about 3.4 million weekly downloads and 66,800 stars, close behind Chart.js for developer enthusiasm.
Baidu built the library, and the Apache Software Foundation now backs it. Canvas rendering handles dense, analytical datasets well.
D3.js
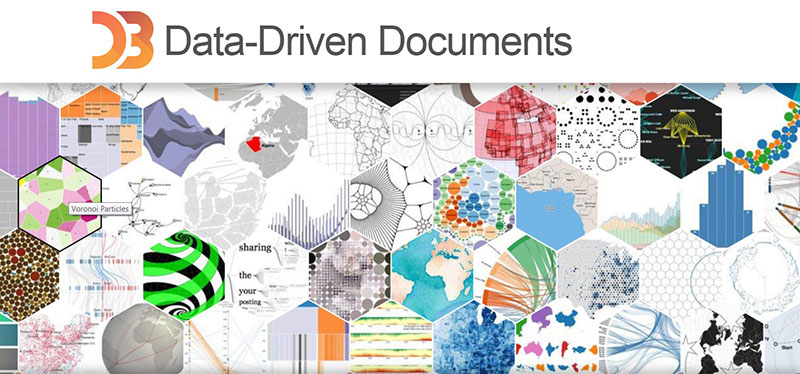
D3.js is a visualization toolkit, not a chart library. Worth being clear about that before you reach for it.
It leads the field on GitHub with roughly 113,000 stars, and pulls somewhere in the region of 13 to 15 million weekly npm downloads. Highest customization ceiling, steepest learning curve, so use it only when off-the-shelf charts can’t match the spec.
Plotly.js
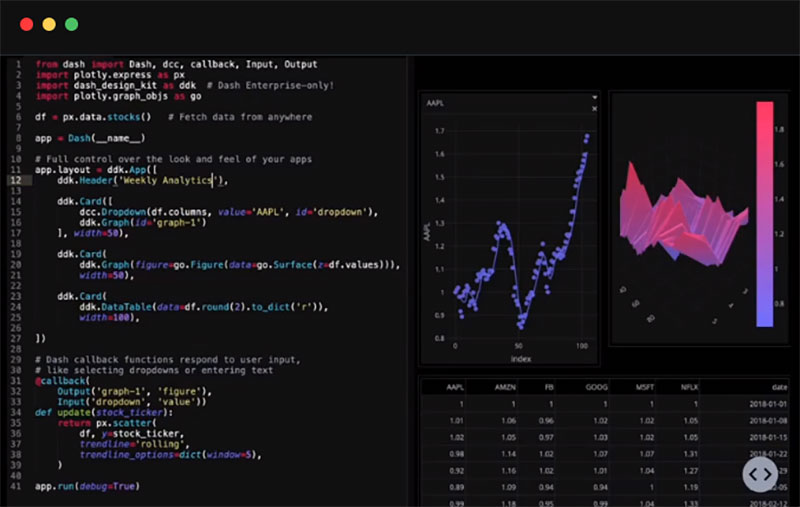
Built on D3 and WebGL, at roughly 18,000 stars. It’s the pick for scientific work: statistical plots and 3D surfaces that Highcharts can’t render natively.
Recharts
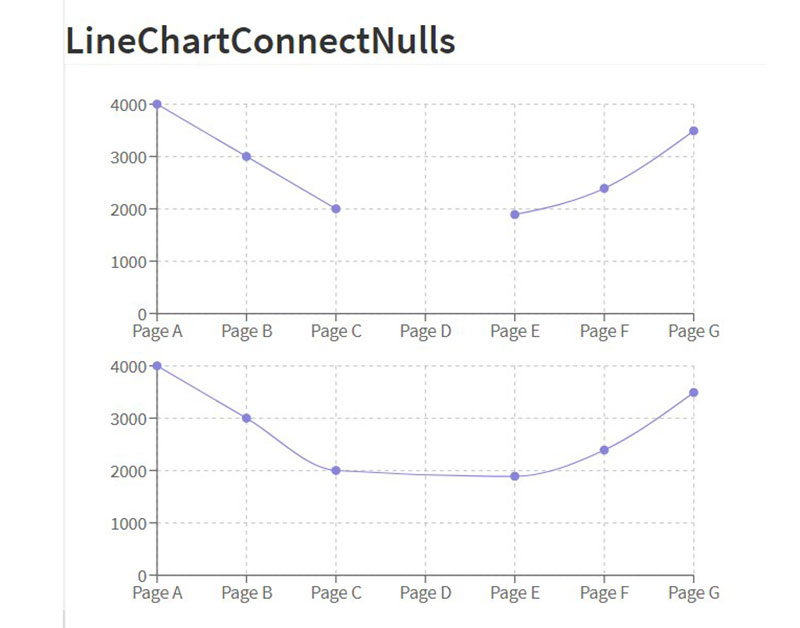
Recharts is the download leader of this whole group by a wide margin, pulling roughly 49 million weekly npm downloads. That’s more than Highcharts, ECharts, and ApexCharts combined.
Worth reading that number with some caution, though. It’s inflated by Recharts arriving as a transitive dependency inside many React UI kits, so it overstates deliberate adoption relative to Chart.js.
- React-native composable components built on D3
- Clean declarative API, strong for dashboards and admin panels
Teams comparing React chart libraries usually shortlist it first.
Google Charts
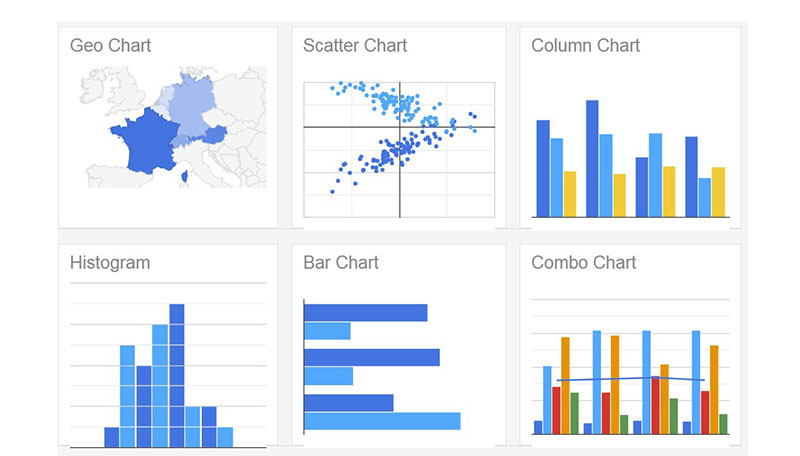
A free, Google-hosted library that renders customizable charts across platforms. It runs as a built-in Google Charts engine inside wpDataTables, right next to Chart.js.
Which Commercial Libraries Compete With Highcharts?
The paid alternatives beat Highcharts on specialized needs rather than across the board. wpDataTables users rarely need any of them, since the plugin bundles Highcharts free.
FusionCharts
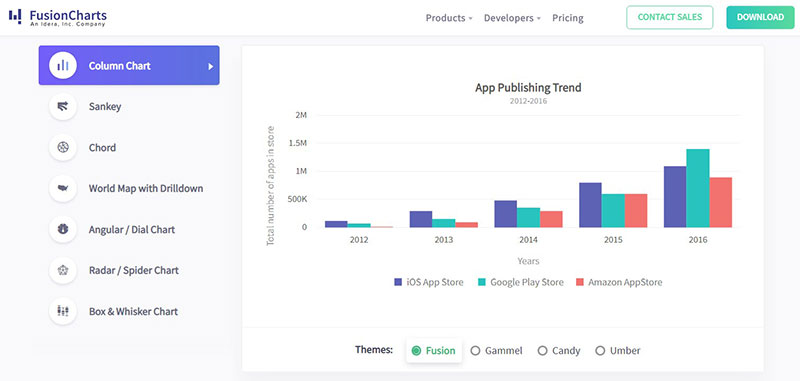
100+ chart types and 2,000+ maps in a single package, aimed at enterprise dashboards and business intelligence tools.
LightningChart JS
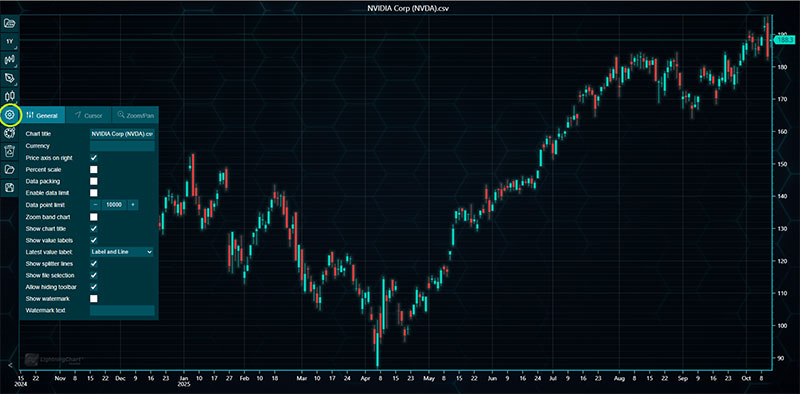
WebGL rendering with native GPU-accelerated 3D: surface charts, 3D scatter, heatmaps, and spectrograms.
The free non-commercial license opens the full library, which makes it a strong pick for GPU-heavy big data visualization.
SciChart
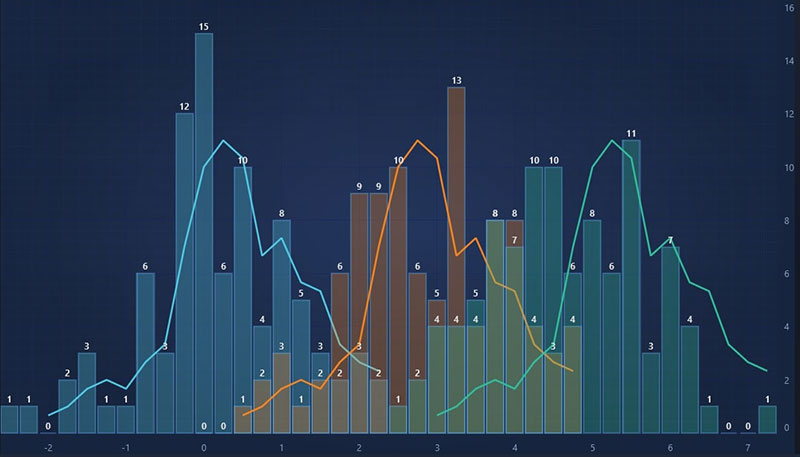
Built for telemetry, trading, and scientific streams, so real-time and big-data work is where it earns its price.
It ships an extensive example library with source code, plus developer tooling including an MCP server and AI assistant.
amCharts
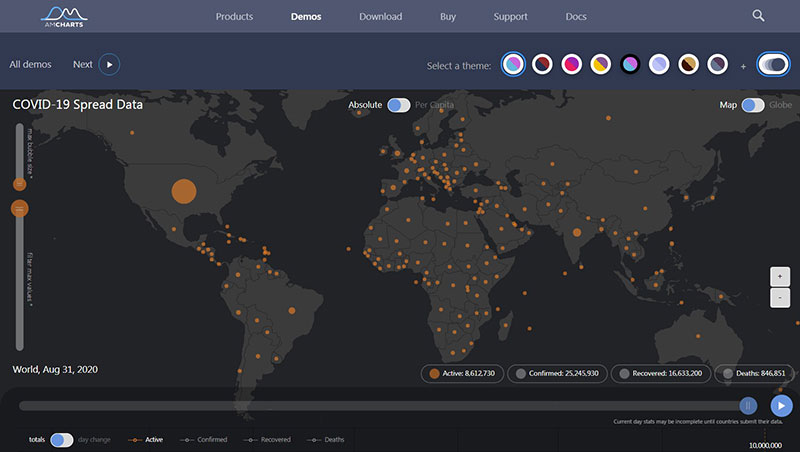
Strong on maps and stock charts, with polished visuals and good TypeScript definitions.
AnyChart and ZingChart
- Broad chart libraries with paid commercial support tiers
- Both cover standard and advanced chart types with quote-based licensing
How Do the Top Highcharts Alternatives Compare on Rendering, Performance, and License?
Rendering engine and license split the field faster than any feature checklist. SVG libraries share one performance floor, Canvas pushes higher, and WebGL clears the highest data volumes.
| Library | Rendering | License | 3D |
|---|---|---|---|
| Highcharts | SVG |
Commercial | Limited |
| Chart.js | Canvas |
MIT free | No |
| ApexCharts | SVG |
MIT free | No |
| Apache ECharts | Canvas |
Apache free | Partial |
| LightningChart JS | WebGL |
Commercial | Native |
Highcharts, ApexCharts, and D3 all render SVG, so they hit the same ceiling near 100,000 points.
When you rank data visualization JavaScript libraries on cost alone, Chart.js and ApexCharts win for being free and framework-friendly.
Which Highcharts Alternatives Are Built Into wpDataTables?
Highcharts (plus Highcharts Stock), Chart.js, Google Charts, and ApexCharts. You pick an engine per chart in the Chart Creation Wizard, and charts redraw automatically when the source table data changes.
| Engine | Rendering | Notes |
|---|---|---|
| Highcharts + Stock | SVG |
Free commercial use in-plugin |
| Chart.js | Canvas |
v4.x line |
| Google Charts | SVG |
Google-hosted |
| ApexCharts | SVG |
Plot-image options |
Across the Google Charts and Chart.js engines alone, wpDataTables builds 23 different types of charts without any code.
The wizard produces a shortcode, so you can embed a chart on any page or post in seconds.
That overlap is the point. Three of the most popular Highcharts alternatives already live inside the same WordPress charts plugin.
How Does wpDataTables Switch Between Highcharts and Its Alternatives?
Everything happens inside the Chart Creation Wizard. Pick Highcharts, Chart.js, Google Charts, or ApexCharts per chart, set the data source and range, customize, then paste the generated shortcode. The wizard steps stay identical across all four engines.
The chart wizard workflow
Same steps, whichever engine you choose:
- Choose the rendering engine for this chart
- Define the data source and the column range
- Customize, save, and copy the shortcode
The built-in chart generator handles the whole flow, and its tools for creating interactive charts need no code.
The plugin’s free Lite version passed 70,000+ active installs on WordPress.org as of mid-2026, with a 4.6 rating.
Options that differ by engine
Each engine exposes its own controls inside the wizard.
| Option | Engine |
|---|---|
| 3D pie | Google Charts |
| Multiple y-axis | Highcharts |
| Plot background image | Highcharts·ApexCharts |
| Curve type | Google Charts·Chart.js |
Highcharts Stock adds OHLC and candlestick views for financial charts and graphs.
Live data and developer callbacks
Charts follow table filtering and redraw automatically when the source data changes, which suits real-time data visualization.
Developers can push native Google Charts, Highcharts, and Chart.js API options straight through wpDataChart callbacks, so nothing about the underlying library is locked away.
How Do You Choose the Right Highcharts Alternative for Your Project?
Match the library to the job. Chart.js or ApexCharts fit simple free dashboards, Apache ECharts handles large datasets, D3.js covers custom visuals, and LightningChart or SciChart cover 3D and real-time work.
| Use Case | Best Pick |
|---|---|
| Simple free dashboard | Chart.js·ApexCharts |
| Large dataset | Apache ECharts |
| Fully custom visuals | D3.js |
| 3D or real-time | LightningChart·SciChart |
| WordPress, no code | wpDataTables |
Match the rendering engine to data volume
The rendering engine sets the ceiling. SVG libraries slow past roughly 100,000 points, Canvas pushes higher, and WebGL clears millions.
ApexCharts’ own State of JavaScript Charting 2026 report reaches the same conclusion: rendering engine is the single most useful way to predict a library’s data ceiling, ahead of any feature list.
Chart.js suits most simple dashboards, and its Chart.js examples show the common line and bar setups.
The no-code path on WordPress
WordPress powered 41.5% of all websites as of mid-2026 (W3Techs), so a code-free engine switch matters for most site owners.
Before you pick a library, know which chart your data actually needs, since matching the chart type to your data comes first.
wpDataTables gives that path directly: four engines, one wizard, and Highcharts free for commercial use inside the plugin.
FAQ About Highcharts Alternatives
What is the best free alternative to Highcharts?
Chart.js and ApexCharts lead the free options. Chart.js uses a Canvas engine with about 12 million weekly downloads, while ApexCharts renders polished SVG charts with strong React and Vue wrappers. Both ship inside wpDataTables.
Is Chart.js better than Highcharts?
It depends on the job. Chart.js is free, Canvas-based, and lighter, so it suits simple dashboards. Highcharts offers deeper features and stock charts but needs a commercial license. wpDataTables includes both, so you can test each.
Which Highcharts alternative is free for commercial use?
Chart.js, ApexCharts, Apache ECharts, and D3.js all carry permissive licenses (MIT or Apache) that allow commercial use. Inside wpDataTables, even Highcharts is free for commercial projects from plugin version 3.0.4.
Does wpDataTables support Highcharts alternatives?
Yes. wpDataTables ships four rendering engines: Highcharts (plus Highcharts Stock), Chart.js, Google Charts, and ApexCharts. You pick one per chart in the wizard, and charts redraw automatically when your table data changes.
What is the best Highcharts alternative for large datasets?
Apache ECharts handles dense data well through Canvas rendering, backed by the Apache Software Foundation. For millions of points, WebGL libraries like LightningChart JS clear the ceiling that SVG-based Highcharts hits near 100,000 points.
Which Highcharts alternative works best with React?
Recharts is React-native, built on D3, and the most-downloaded chart package on npm at roughly 49 million weekly downloads. ApexCharts also offers official React wrappers. Teams comparing React chart libraries usually shortlist both before anything else.
Is Apache ECharts a good Highcharts alternative?
Yes. Apache ECharts pulls about 3.4 million weekly downloads and 66,800 GitHub stars, strong in analytical and geospatial charts. It is free under the Apache license, unlike Highcharts, which charges for commercial use.
What is the best Highcharts alternative for financial or stock charts?
amCharts and LightningChart handle financial visuals well, but Highcharts Stock still leads for OHLC and candlestick charts. Inside wpDataTables, Highcharts Stock covers these views with no license fee.
Do Highcharts alternatives support the same chart types?
Most cover line, bar, pie, area, and scatter. Highcharts adds gauges and stock views. Across Google Charts and Chart.js alone, wpDataTables builds 23 different chart types without code.
How do I add a Highcharts alternative in WordPress without code?
Install wpDataTables, open the Chart Creation Wizard, pick Chart.js, Google Charts, or ApexCharts, set your data range, then paste the shortcode. No coding, and charts update when the source data changes.
Conclusion
Choosing among Highcharts alternatives comes down to three things: rendering engine, license, and dataset size.
Apache ECharts and D3.js win on scale and control. Chart.js keeps things light, while LightningChart JS pushes into WebGL and 3D.
FusionCharts and Recharts round out the field for enterprise dashboards and React apps.
For financial views, Highcharts Stock still holds ground on OHLC and candlestick data.
On WordPress, the choice gets simpler. wpDataTables bundles four rendering engines in one no-code Chart Creation Wizard, so you switch between Canvas and SVG output in a click.
Match the library to your data volume and budget, then build.
Most teams never need a commercial license once they see how far the open-source options reach.