Calculation Functions do not inherit the style you apply to font in wpDataTables settings, so to change the color of AVG, SUM, MIN and MAX, you need to add some custom CSS:
.wdt-sum-cell, .wdt-avg-cell, .wdt-min-cell, .wdt-max-cell {
color: red !important;
}
From plugin version 5.3, horizontal bar chart is available as option in chart wizard.
By default chart engine’s behavior, column chart cannot be inverted, so X axis becomes Y axis and vice versa. That’s where wpDataCharts Callbacks come in again. Every chart exposes several options that customize its look and feel. Charts usually support custom options appropriate to that visualization. You can use it for adding options that are available in Charts.js API.
In this example, we look at Global Smartphone Shipments (in millions of units) since Q3 2018, until Q3 2019. Initially, the chart would come up like this:
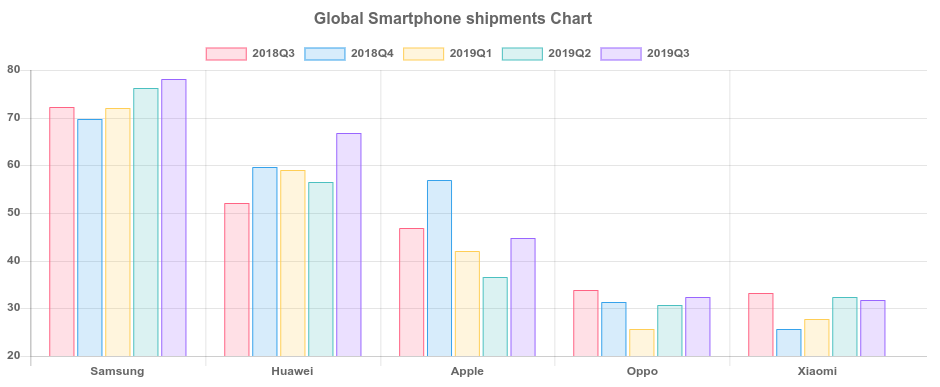
To make the chart display the bars horizontally, you need to enter the following callback in HTML format above the chart’s shortcode, like this:
<script type="text/javascript">
jQuery(window).on('load',function(){
    if( typeof wpDataChartsCallbacks == 'undefined' ){ wpDataChartsCallbacks = {}; }
    wpDataChartsCallbacks[95] = function(obj) {
        obj.options.type = 'bar';
        obj.options.options.indexAxis = 'y';
    };
});
</script>
For a chart that has this many bars, it’s recommended to change the default chart’s height in the creation wizard. So with the height set to 800px, and the callback seen above applied, the chart finally looks like this:
If your PostgreSQL is installed on Ubuntu 18.04 server, and you’re receiving the following error:
“wpDataTables could not connect to postgresql server. postgresql said: There was a problem with your SQL connection – could not find driver”
You may need to install PGSQL driver by following these steps:
[sudo] apt-get install php-pgsql
Then uncomment pgsql and pdo-pgsql extentions in php.ini and restart Apache with the following command:
[sudo] /etc/init.d/apache2 restart
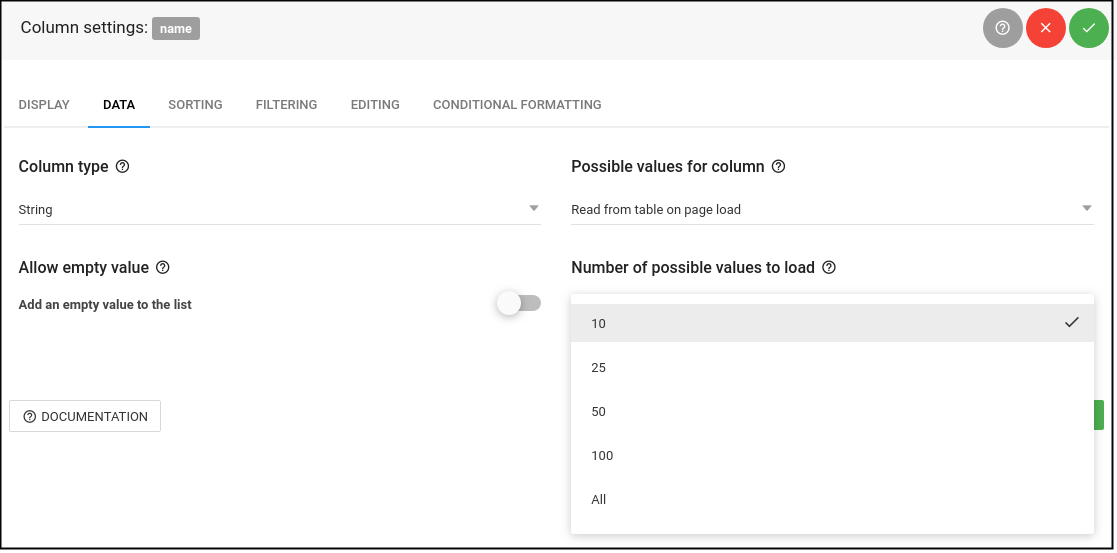
If you have a column which contains more than 10 values, you may need to search through the filter to find the correct filtering option. This happens because the number of possible values to load is set to “10”, and if you want to show more data in that column’s filter you need to open column settings, go to Data tab, and change the “Number of possible values to load” from “10” to “All”, and you’ll be able to see all entries.
The Cryptocurrencies rank table is a manual table, so we start by creating a manual table with 10 columns (one integer, and 9 string-type columns). We’re using the “Aqua” skin for our tables, but you’re welcome to try other skins as well.
The table settings are:
Display tab:

Sorting and Filtering tab:

Editing tab:

Table Tools tab:

Placeholders tab is not being used in this case, so whatever data you have in those fields should not be changed.
1. First Column ( “#” ) – Only this column is an integer column, which is used as the default sorting column for the table. When creating the column, you need to enter a different name, though (in our case it’s “rd”), because “#” cannot be stored in the database, so simply set the displayed header to “#”:
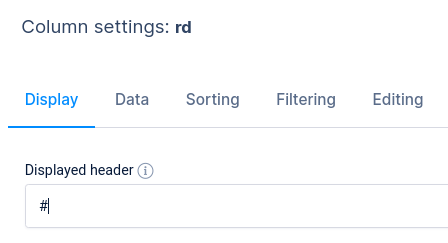
Settings for this column are:
Display tab:
- “Visible on front-end” enabled
- “Column width” set to “100”
Sorting tab – Like mentioned before, this column is used as the default sorting column for the table:

Filtering for this column is enabled, and we added a label to the filter – “Position”:

Editing has been enabled, and Editor-input type is set to “One-Line edit”, so you can enter data in back-end when creating the table.
There is no Conditional Formatting applied to this column.
2. Second column ( “Name” ) – This is a string column which requires some work. First, we open column settings and apply the following in the Display tab:
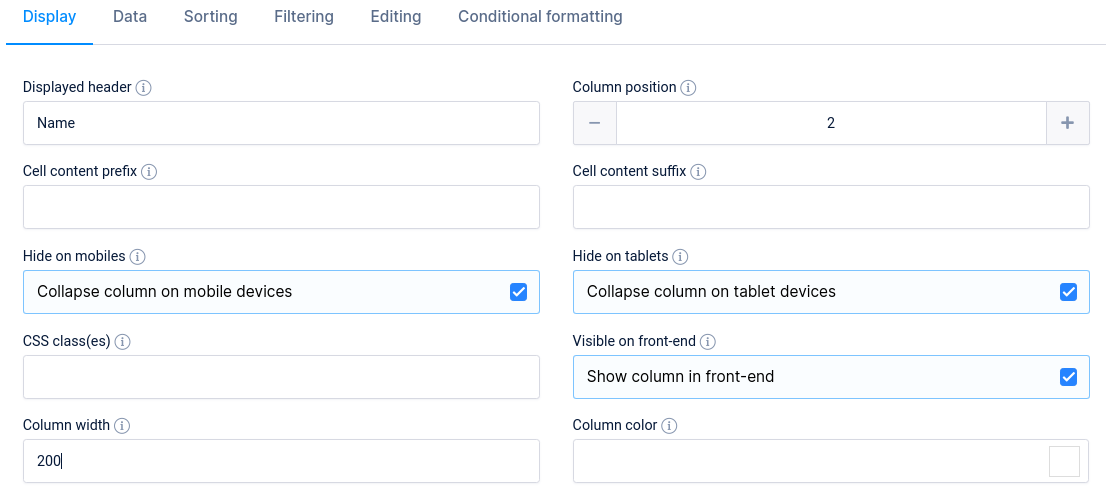
Here we’ve defined the column width to be 200px (please note that this is only possible if you enable Limit table width in table settings above the table), and added a CSS class “cripto-div”, which is used to vertically center the cells of this column. To define the CSS class, you will need to go to wpDataTables settings/Custom JS and CSS/Custom CSS, and add the following to the Custom CSS field:
.cripto-div {
   vertical-align: middle;}
.cripto-div span {font-size: 16px;font-weight: 600;margin-left: 5px;vertical-align: top !important;margin-top: 6px;}
The cryptocurrencies’ icons are all stored in a single .png file, which you can access on this link. You need to add a CSS class in Custom CSS field to be able to access the image:
.cripto-sprite {display: inline-block;margin: 0 2px;background-image: url(https://wpdatatables.com/wp-content/uploads/2018/12/cripto-sprite.png);width: 16px;height: 16px;}
.cripto-sprite{
    background-image: url(https://wpdatatables.com/wp-content/uploads/2019/02/Artboard.png);
    background-repeat: no-repeat;
    background-size:160px;
    width: 32px;
    height: 32px;
    margin-left:0 !important;
}
To access these icons individually, and add them in rows you need to add a CSS class which would locate the icon’s position in that .png file – to specify the coordinates, so to speak. To do that, you need to add a new class for every cryptocurrency. For example, the icon coordinates for Bitcoin are accessed with the following CSS:
.cripto-1{background-position: -734px -207px;}
Since we have 20 cryptocurrencies in that table, the full coordinates CSS which you need to add in Custom CSS field would look like this:
.cripto-1{background-position: -734px -207px;}
.cripto-1{background-position: -734px -207px;}
.cripto-2{background-position: -176px -64px;}
.cripto-3{background-position: -734px -48px;}
.cripto-4{background-position: -416px -639px;}
.cripto-5{background-position: -176px -96px;}
.cripto-7{background-position: -16px -96px;}
.cripto-8{background-position: -638px -557px;}
.cripto-9{background-position: -238px -160px;}
.cripto-10{background-position: -464px -623px;}
.cripto-11{background-position: -638px -399px;}
.cripto-12{background-position: -192px -655px;}
.cripto-13{background-position: -16px -336px;}
.cripto-14{background-position: -304px -639px;}
.cripto-15{background-position: -400px -687px;}
.cripto-16{background-position: -32px -80px;}
.cripto-17{background-position: -480px -463px;}
.cripto-18{background-position: -128px -687px;}
.cripto-19{background-position: -718px -64px;}
.cripto-20{background-position: -702px -395px;}

.cripto-1 {
background-position: 0 0;
}
.cripto-2 {
background-position: -32px 0;
}
.cripto-3 {
background-position: -64px 0;
}
.cripto-4 {
background-position: -96px 0;
}
.cripto-5 {
background-position: -128px 0;
}
.cripto-6 {
background-position: 0 -32px ;
}
.cripto-7 {
background-position: -32px -32px;
}
.cripto-8 {
background-position:  -64px -32px;
}
.cripto-9 {
background-position: -96px -32px;
}
.cripto-10 {
background-position:-128px -32px;
}
.cripto-11 {
background-position: 0 -64px;
}
.cripto-12 {
background-position: -32px -64px;
}
.cripto-13 {
background-position: -64px -64px;
}
.cripto-14 {
background-position:  -96px -64px;
}
.cripto-15 {
background-position:  -128px -64px;
}
.cripto-16 {
background-position: 0 -96px;
}
.cripto-17 {
background-position:  -32px -96px;
}
.cripto-18 {
background-position:  -64px -96px;
}
.cripto-19 {
background-position: -96px -96px;
}
.cripto-20 {
background-position: -128px -96px;
}
Then, when you edit the first row, you need to enter the following code, so the image is pulled and added in front of “Bitcoin” in that row:
<div class="cripto-1 cripto-sprite"></div>Bitcoin
Which would look like this in the edit modal:
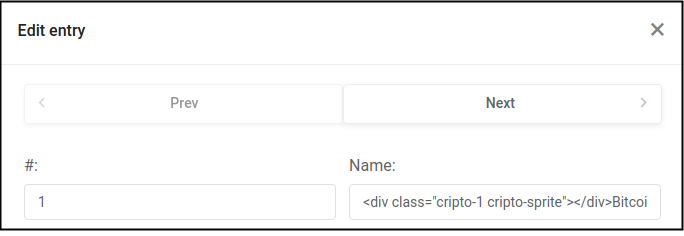
So, to apply this for each row individually, you should add them in the edit modal one at a time using the lines of code below:
<div class="cripto-1 cripto-sprite"></div>Bitcoin
<div class="cripto-2 cripto-sprite"></div>XRP
<div class="cripto-3 cripto-sprite"></div>Ethereum
<div class="cripto-4 cripto-sprite"></div>Bitcoin Cash
<div class="cripto-5 cripto-sprite"></div>Stellar
<div class="cripto-6 cripto-sprite"></div>EOS
<div class="cripto-7 cripto-sprite"></div>Tether
<div class="cripto-8 cripto-sprite"></div>Litecoin
<div class="cripto-9 cripto-sprite"></div>Bitcoin SV
<div class="cripto-10 cripto-sprite"></div>TRON
<div class="cripto-11 cripto-sprite"></div>Cardano
<div class="cripto-12 cripto-sprite"></div>IOTA
<div class="cripto-13 cripto-sprite"></div>Monero
<div class="cripto-14 cripto-sprite"></div>Binance Coin
<div class="cripto-15 cripto-sprite"></div>Dash
<div class="cripto-16 cripto-sprite"></div>NEM
<div class="cripto-17 cripto-sprite"></div>Ethereum Classic
<div class="cripto-18 cripto-sprite"></div>NEO
<div class="cripto-19 cripto-sprite"></div>Waves
<div class="cripto-20 cripto-sprite"></div>Zcash
That covers the creation of the second column, and filling out its data.
3. Columns 3 – 10 all have the same CSS class applied to them – “aligncentarcell”. Go ahead, and apply this class in column settings for columns 3 – 10:
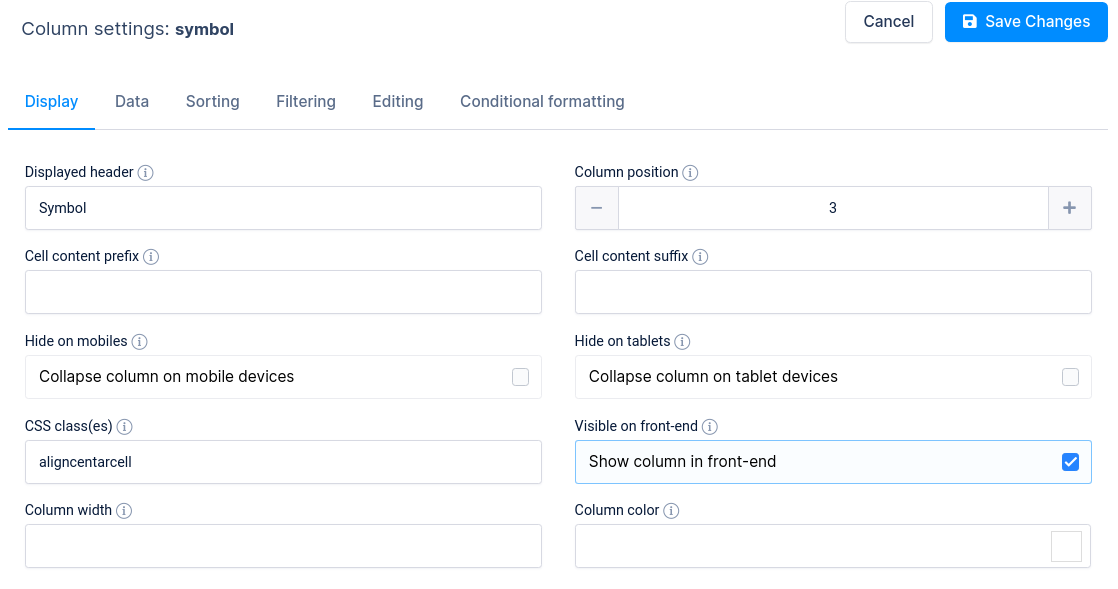
This class aligns the text horizontally in the center, using the following CSS:
.wpDataTablesWrapper table.wpDataTable td.aligncentarcell,
.wpDataTablesWrapper table.wpDataTable th.aligncentarcell
{ text-align: center !important; }
With this, you will have completed the custom setup of columns #3, #4 and #6 ( “Symbol”, “Market Cap” and “Circulating Supply” ).
Third column ( “Symbol” ) – column settings:
Display tab:
- “Visible on front-end” enabled
Data tab: keeps default settings.
Sorting tab: Sorting is allowed.
Filtering tab: Filtering is allowed, filter type set to “Checkbox”, with no labels applied, no exact filtering, no pre-defined filter values, and filters are rendered in modal form.
Editing tab: One-line edit.
There is no Conditional Formatting applied to this column.
Fourth column ( “Market Cap” ) and sixth column ( “Circulating Supply” ) – columns settings are the same:
Display tab:
- “Visible on front-end” enabled
- “Hide on mobiles” enabled
- “Hide on tablets” enabled
Data tab: keeps default settings.
Sorting tab: Sorting is allowed.
Filtering tab: Filtering is allowed, filter type set to “Text”, with no labels applied, no exact filtering, no pre-defined filter values, and filters are rendered in modal form.
Editing tab: One-line edit.
There is no Conditional Formatting applied to these columns.
4. Since we already saved the “aligncentarcell” CSS class for the Fifth Column ( “Price” ), we need to add some Conditional Formatting to it. It uses only one rule:

This rule tells the table to call the “blue-text” CSS class when the cell value contains a dot ( . ). The CSS you need to apply in Custom CSS field is:
.blue-text{color: #0083c2 !important;}
The same CSS class will be used for the seventh column, but we’ll get to that after we go through settings for the fifth column:
Display tab:
- “Visible on front-end” enabled
- “Hide on mobiles” enabled
- “Hide on tablets” enabled
Data tab: keeps default settings.
Sorting tab: Sorting is allowed.
Filtering tab: Filtering is allowed, filter type set to “Text”, with no labels applied, no exact filtering, no pre-defined filter values, and filters are rendered in modal form.
Editing tab: One-line edit.
5. The seventh column ( “Volume” ) has settings similar to the “Price” column, but with a comma ( , ) instead of a dot ( . ) applied in the conditional formatting rule, so:

This rule tells the table to call the “blue-text” CSS class when the cell value contains a comma ( , ). Since the CSS class is already entered, there’s no need to repeat the process.
Display tab:
- “Visible on front-end” enabled
- “Hide on mobiles” enabled
- “Hide on tablets” enabled
Data tab: keeps default settings.
Sorting tab: Sorting is allowed.
Filtering tab: Filtering is allowed, filter type set to “Text”, with no labels applied, no exact filtering, no pre-defined filter values, and filters are rendered in modal form.
Editing tab: One-line edit.
6. Columns #8, #9 and #10 ( “% 1h”, “% 24h” and “$ 7d” ) have the same set up with only one difference:
Custom column width of “90” is applied in the Display tab when you access the column settings for columns #8 and #10, while column #9 has the custom width set to “100”. All other settings are the same for these three columns – there are a couple of Conditional Formatting rules applied:

These rules tell the table to paint the values of a cell in red if there is a minus sign ( – ) present in that cell, and to paint the values in green if the sign is not present. So, we need to add a couple more CSS classes:
.red-text{color: #d94040 !important;}
.green-text{color: #009e73 !important;}
Same column settings apply to all three columns:
Display tab:
- “Visible on front-end” enabled
- “Hide on mobiles” enabled
- “Hide on tablets” enabled
Data tab: keeps default settings.
Sorting tab: Sorting is allowed.
Filtering tab: Filtering is allowed, filter type set to “Text”, with no labels applied, no exact filtering, no pre-defined filter values, and filters are rendered in modal form.
Editing tab: One-line edit.
That completes the creation of the Cryptocurrencies rank table, and if you followed the tutorial closely, you should have the same table in your database now.
