How can we help?

Choose sections:

  • Styling and CSS
  • Technical issues
  • Column settings
  • Licensing and support
  • Charts
  • Pre-purchase questions
  • Advanced filtering
  • Examples
  • Addons
  • Table settings
Expand All | Collapse All
  • 1. How to center text in the table?
     

    If you need to apply for all tables then just add this code below in Custom wpDataTables CSS under the "Custom JS AND CSS" in main settings of wpDataTables. In this example we align the text in the center of the table, you can change the text-align to your desire by changing the word “center” to “left” or “right.

    .wpDataTablesWrapper table.wpDataTable td, 
    .wpDataTablesWrapper table.wpDataTable th,
    .wpDataTablesWrapper table.wpDataTable td.numdata, 
    .wpDataTablesWrapper table.wpDataTable th.numdata
    { text-align: center !important; }
    

    This will be affected on all tables, but if you want just for specific one then insert this code on the CUSTOM CSS under Customize tab in table settings and you will use clases with id's for that table (Example if your table have id 1)

    .wpDataTablesWrapper table.wpDataTable.wpDataTableID-1 td,
    ​.wpDataTablesWrapper table.wpDataTable.wpDataTableID-1 th,
    .wpDataTablesWrapper table.wpDataTable.wpDataTableID-1 td.numdata,
    ​.wpDataTablesWrapper table.wpDataTable.wpDataTableID-1 th.numdata
    { text-align: center !important; }
    
    Permalink
    Was this answer helpful ?

    Yes No
    Viewed 22208 Times
  • 2. How to hide pagination?
     

    From version 3.2 you have built-in option for hiding pagination and more. Now you are able to change the position of the pagination(right, left, and center) and there are six different layouts of the pagination available which you can set for each table. More on this link.

    Just add this code in Custom wpDataTables CSS under the "Custom JS AND CSS" in main settings of wpDataTables.

    .wpDataTablesWrapper .dataTables_paginate{display : none !important;}
    

    This will be affected on all tables, but if you want just for specific one then insert this code on the page where is that table between the style tag (<style>Code here</style>).

    <style>
    .wpDataTablesWrapper .dataTables_paginate{display : none !important;}
    </style>
    
    Permalink
    Was this answer helpful ?

    Yes No
    Viewed 15658 Times
  • 3. How to hide New, Edit or Delete buttons?
     

    To hide New, Edit or Delete button you can add one of this CSS in Custom CSS field on
    wpDataTables settings page or directly on the page between<style>Your code</style> tags:

    .DTTT_button_new {
    display: none !important;
    }
    .DTTT_button_delete {
    display: none !important;
    }
    .DTTT_button_edit {
    display: none !important;
    }
    Permalink
    Was this answer helpful ?

    Yes No
    Viewed 16566 Times
  • 4. How can I set option Scrollable just on mobile devices?
     

    You can set this by inserting this CSS code in Custom wpDataTables CSS under the "Custom JS AND CSS" in main settings of wpdatatables.

    @media screen and (min-width: 780px) {
       .wpDataTablesWrapper div.wdtscroll {
         overflow-x: initial !important;
       }
    }
    

    This will be affected on all tables, but if you want just for specific one then insert this code on page where is that table between the style tag.(<style>Code here</style>)

    <style>
    @media screen and (min-width: 780px) {
        .wpDataTablesWrapper div.wdtscroll {
          overflow-x: initial !important;
        }
    }
    </style>
    

    Please note that Scrollable option should be turned on in the table settings.

    Permalink
    Was this answer helpful ?

    Yes No
    Viewed 14840 Times
  • 5. Which selectors are for SUM, AVG, MIN and MAX?
     

    For customization of layout for options Calculating totals, minimum, maximum and average cells in wpDataTables you can use this selectors:

    .wdt-sum-cell,  /* for totals  */
    .wdt-avg-cell,  /* for average */
    .wdt-min-cell,  /* for minimum */
    .wdt-max-cell,  /* for maximum */
    
    Permalink
    Was this answer helpful ?

    Yes No
    Viewed 14469 Times
  • 6. The text of the row start on top and not in the middle of the row. How can i make that?
     

    Just add this code in Custom wpDataTables CSS under the "Custom JS AND CSS" in main settings of wpdatatables.

    table.wpDataTable tbody tr td{
    vertical-align:top !important;
    }

    That will be effected on all tables, but if you want for specific tables then insert this code between style tags on the page where is that table.

    <style>
    table.wpDataTable tbody tr td{
    vertical-align:top !important;
    }
    </style>
    Permalink
    Was this answer helpful ?

    Yes No
    Viewed 14541 Times
  • 7. How can I style looks of the Table Tools buttons of a table?
     

    You can use CSS class for each button.

    .DTTT_button_print /* for print */
    .DTTT_button_xls   /* for excel */
    .DTTT_button_csv   /* for csv   */
    .DTTT_button_copy  /* for copy  */
    .DTTT_button_pdf   /* for pdf   */
    

    You can insert your custom CSS for this buttons in Custom wpDataTables CSS under the "Custom JS AND CSS" in main settings of wpdatatables. If you want for specific tables then insert this code between style tags on the page where is that table.

    Permalink
    Was this answer helpful ?

    Yes No
    Viewed 16129 Times
  • 8. How do I change the color of Calculation Functions?
     

    Calculation Functions do not inherit the style you apply to font in wpDataTables settings, so to change the color of AVG, SUM, MIN and MAX, you need to add some custom CSS:

    .wdt-sum-cell, .wdt-avg-cell, .wdt-min-cell, .wdt-max-cell {
    color: red !important;
    }
    
    Permalink
    Was this answer helpful ?

    Yes No
    Viewed 11007 Times
  • 9. How can I remove table header?
     

    Just add this code below in Custom wpDataTables CSS under the "Custom JS AND CSS" in main settings of wpDataDables.

    .wpdt-c .wpDataTablesWrapper table.wpDataTable thead {
    display: none !important;
    }

    This will be affected on all tables, but if you want just for specific one then insert this code on the page where is that table between the style tag (<style>Code here</style>)

    <style>
    .wpdt-c .wpDataTablesWrapper table.wpDataTable thead {
    display: none !important;
    }
    </style>
    
    Permalink
    Was this answer helpful ?

    Yes No
    Viewed 17063 Times
  • 10. How to hide "Apply and add new", "Next" and "Prev" buttons from the edit modal?
     

    If you don't want to offer options Prev, Next and Apply and add new in your edit modal, you can hide them with some simple CSS.

    To hide them from all tables, use one of the following codes in Custom CSS field, found in Custom JS and CSS tab in main settings of wpDataTables:

    .wdt-apply-edit-button {
    display: none !important;
    }
    
    .wdt-prev-edit-button {
    display: none !important;
    }
    
    .wdt-next-edit-button {
    display: none !important;
    }
    

    If, on the other hand, you wish to use this only for certain tables in front-end, you can place one of these codes directly on the page between <style>Your code</style> tags.

    Permalink
    Was this answer helpful ?

    Yes No
    Viewed 13573 Times
  • 1. What can I do if advanced filtering and global search is not working?
     

    This usually happens for MySQL-based tables with server-side processing turned on.

    Please check if you have a complicated query with JOINs, calculated columns (for example, ” SELECT mycolumn*2 AS mycolumn2″), or some custom column aliases (e.g. “SELECT mycolumn AS ‘some/weird/name’). If this is the case, please either create a MySQL view (in PHPMyAdmin or similar MySQL DB manager) and build a wpDataTable based on this view.

    From version 2.3 we implement feature that you can use multiply separate db connections for (MySQL,MSSQL and PostgreSQL) and for MySQL engine we are dynamically adding accent grave (`). If you use this accent grave (`) in your query, please remove it and searching and filtering will work fine.


    You can check out the video and step by step guide on this YouTube link

    Permalink
    Was this answer helpful ?

    Yes No
    Viewed 17916 Times
  • 2. I added a table but see no sorting, filtering or pagination
     

    1. Please check first if PHP version is at least 5.4 or newer. It is required for the proper running of wpDataTables.

    2. The second thing to check is that there are no JS errors in the javascript console. Please check e.g. in Chrome JS console. Usually when we investigate such things we find out that some other plugin or theme are broken, and wpDataTables JS cannot execute.

    3. Try to turn off option "Include bootstrap on front-end" in main settings of the plugin.

    4. Please try to deactivate other plugins one by one and check if some of them are in conflict with wpDataTables.

    5. Please try switching the theme to a different one and see if it helps.

    Permalink
    Was this answer helpful ?

    Yes No
    Viewed 14156 Times
  • 3. Can’t connect to remote MySql database?
     

    If you are using separate MySQL connection option to connect to MySQL database, you can test if connection can actually be established with “Test MySQL settings” button.
    If connection can’t be established, first please make sure that all entered values needed for connection are correct.
    Also make sure that MySQL server is allowing remote connections and that MySQL user that you are trying to connect with is allowed to connect from your sites host(IP address).

    From 2.3 version of our plugin there is an option to add more than one separate database connection. Now every table can have its own separate database connection, so tables can pull data from multiple databases and servers.

    Permalink
    Was this answer helpful ?

    Yes No
    Viewed 15648 Times
  • 4. What to do if I get error in Console 403 Forbidden?
     

    The 403 Forbidden error is an HTTP status code which means that accessing the page or resource you were trying to reach is absolutely forbidden for some reason. Our suggestion is to check your server log and see if there are some errors and also if you have some security plugins please try to deactivate it and see if it will work after that. Also, check if the mod_security is turn-on on your server.

    Permalink
    Was this answer helpful ?

    Yes No
    Viewed 15683 Times
  • 5. What to do if I get in Console 404 error ?
     

    If you get this error  for admin-ajax.php in Console of the browser please check do you have some firewall or some security (some plugin or turn on mod_security) on a server that causes not finding WordPress native file admin-ajax.php, that we used for ajax calls.

    Permalink
    Was this answer helpful ?

    Yes No
    Viewed 14070 Times
  • 6. What to do if I get error Failed to connect: Network is unreachable?
     

    We suppose that your server is on Bluehost. If the answer is yes, you have to add some code in
    file ../wp-content/plugins/wpdatatables/source/class.wdttools.php around line 205 you will  find this line of code:

    curl_setopt($ch, CURLOPT_REFERER, site_url());
    

    and after it add:

    curl_setopt( $ch, CURLOPT_IPRESOLVE, CURL_IPRESOLVE_V4);
    

    This fix should resolve the issue that is related with Bluehost. Your code should looks like below.

    curl_setopt($ch, CURLOPT_URL, $url);
    curl_setopt($ch, CURLOPT_RETURNTRANSFER, 1);
    curl_setopt($ch, CURLOPT_CONNECTTIMEOUT, $timeout);
    curl_setopt($ch, CURLOPT_USERAGENT, $agent);
    curl_setopt($ch, CURLOPT_REFERER, site_url());
    curl_setopt( $ch, CURLOPT_IPRESOLVE, CURL_IPRESOLVE_V4);
    
    Permalink
    Was this answer helpful ?

    Yes No
    Viewed 13675 Times
  • 7. What can I do if get error "Please provide a valid 2-dimensional array"?
     

    You are probably getting this error because you have formatting in that spreadsheet. Can you please remove that formatting from a file, because when you make wpDataTables you can adjust the look of the table and arranged data how you want. Please note that merge cells can also produce this issue because at the moment they are not supported in wpDataTables.

    Permalink
    Was this answer helpful ?

    Yes No
    Viewed 14037 Times
  • 8. What are system requirements for wpdatatables?
     

    You can find minimum requirements in our documentation on this link.

    Permalink
    Was this answer helpful ?

    Yes No
    Viewed 14141 Times
  • 9. When I push "+New" to fill new values into the table, the popup disappears?
     

    You have some conflict with theme or other plugin. Please insert this in Custom wpDataTables CSS under the "Custom JS AND CSS" in main settings of wpdatatables.

    .wpdt-c .modal{ width: inherit !important ; background-color: initial !important; }
    
    Permalink
    Was this answer helpful ?

    Yes No
    Viewed 13687 Times
  • 10. What can I do if I can't use edit modal?
     

    If you get grey screen when you try to edit or add new data in wpdatatables(like on image) you have some conflict with theme or some other plugin.

    edit modal grey

    Try to add this code in the custom CSS field in wpdatatables settings page

    .wpdt-c .modal-backdrop{ z-index: 0 !important; }
    

    or

    .modal-backdrop{ z-index: 0 !important; }
    
    Permalink
    Was this answer helpful ?

    Yes No
    Viewed 15331 Times
  • 11. I'm trying to create a table with Google spreadsheet but I get the error message "Table in data source has no rows."?We encounter this issue recently and it looks like that the URL link that you get when you publish the document is not valid. (contain 2PACX in URL) So can you please use the URL link that you get from the browser and see if the issue is gone.
     

    Hello all wpDataTables users!

    Google changed their API, and almost all tables created in Creating Tables in WordPress from Google Spreadsheets are affected.

    The issue is displayed either as a "Table in the data source has no rows" error when trying to create a new table, or "No data available in the table" in an existing table.

    There is a temporary workaround for the issue until we resolve it for good.

    What you need to do in your Google sheet is to share this sheet with everyone.

    When you visit your already published sheet, click on the "Share" button in the top right corner of your sheet:

    On the modal that pops up, click on "Change to anyone with link text":

    After that, your tables will show up again like ours did in our documentation on this link.

    Sorry for the inconvenience, and thank you for your patience!

    This issue can occur for several reasons:

    1. You've copied the URL from the "Publish to the web" modal that pops up when you publish the spreadsheet:These links are recognized easily because they all contain "2PACX":
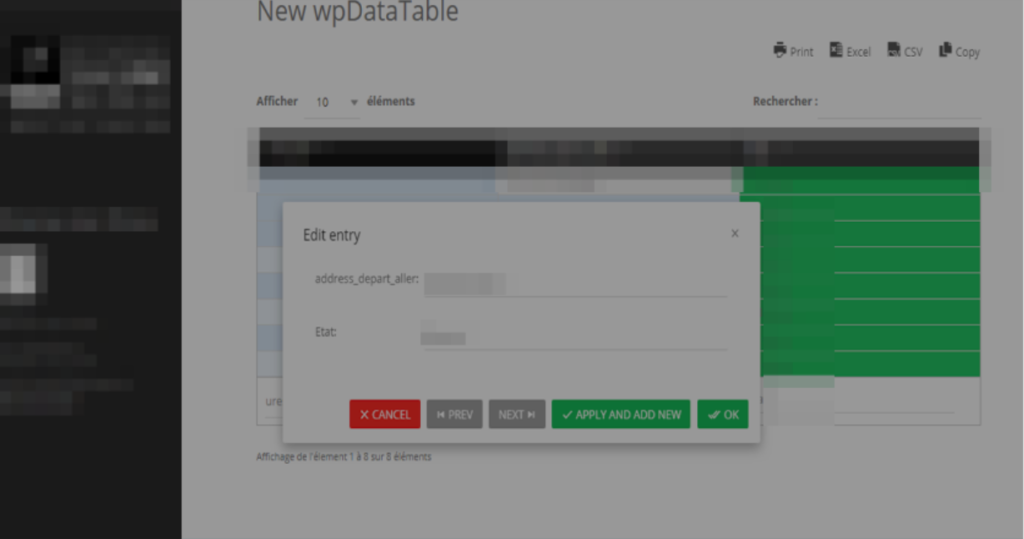
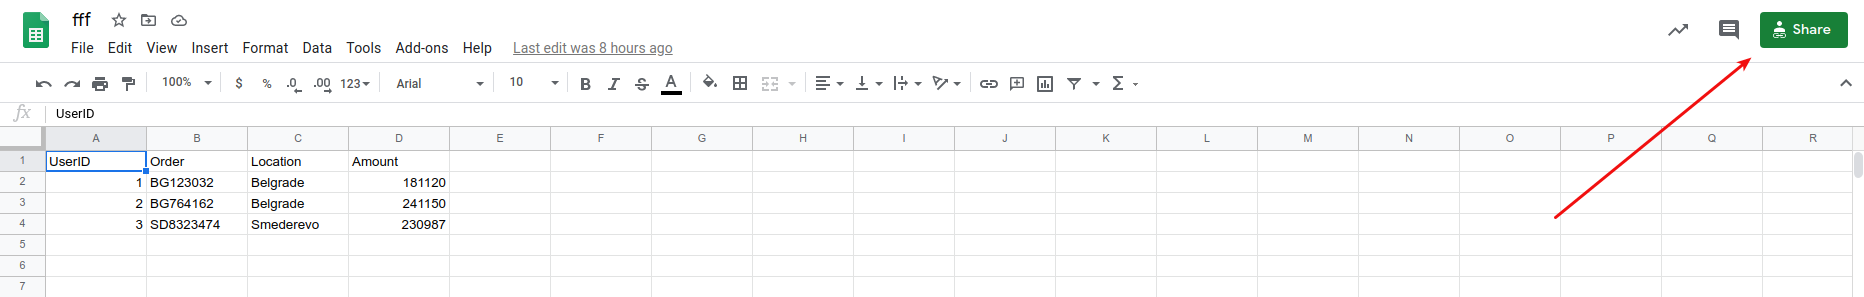
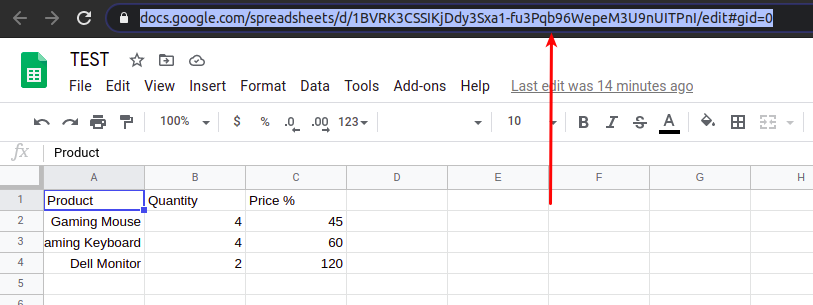
After the spreadsheet is published, just close that modal window that opens up, and copy the URL from the browser's address bar and paste it into wpDataTables corresponding URL field when creating a table linked to an existing Google Spreadsheet file:
    2. You don't have ZipArchive installed on your server, or you're using an older version of ZipArchive. Please reach out to your hosting provider and ask them to either install or update the ZipArchive.
    3. The data in the Google Spreadsheet file is not structured correctly. Please remember that wpDataTables cannot import tables from other sources that contain merged cells; sub-headers; multiple empty rows below the first row. Also, keep in mind that the first row in your Google Spreadsheet file needs to contain column headers and that all data should be entered in columns below those headers.
    4. Applying any formatting in the file, like custom collation, Google Spreadsheet formulas, IMPORTRANGE functions, custom colors, etc. may cause an issue like this.
    5. If the Google account from which you've created the Spreadsheet is a part of a business (G-Suite), publishing may be allowed, but due to security measures it is not visible (accessible) from wpDataTables.

    You can find more details in our documentation about Creating Tables in WordPress from Google Spreadsheets

    Permalink
    Was this answer helpful ?

    Yes No
    Viewed 15395 Times
  • 12. How to transfer plugin with all tables from localhost or stage site to production?
     

    When you are moving on live site from local or stage site we can suggest to use Plugin Duplicator. We use it and it's working fine, because he will transfer all the files and also the tables to database.

    Permalink
    Was this answer helpful ?

    Yes No
    Viewed 14026 Times
  • 13. What can I do if my table is not show properly when I use Limit table width in Internet Explorer?
     

    Because Internet Explorer didn't stick to the guidelines established by World Wide Web Consortium the organization that establishes standards for web technologies, it often would display web pages in ways that made them look entirely different from other browsers Opera, Chrome or Firefox.

    Please try to find this file ../wp-content/plugins/wpdatatables/source/class.wpdatatable.php and around line 2794 find this line:

    $returnData .= $this->isFixedLayout() ? "table.wpDataTable { table-layout: fixed !important; }\n" : '';
    

    after that line add this line of code:

    $returnData .= $this->isFixedLayout() ? "table.wpDataTable thead th { width: 100% !important;}\n" : '';
    
    Permalink
    Was this answer helpful ?

    Yes No
    Viewed 13701 Times
  • 14. What to do if I get error 413 Request Entity Too Large?
     

    413 Request Entity Too Large errors occur when the request body is larger than the server is configured to allow. Here’s how you can fix it, depending on your web server:

    Permalink
    Was this answer helpful ?

    Yes No
    Viewed 14334 Times
  • 15. I am using Cherry plugin and tables are not working properly. What can I do?
     

    Cherry plugin cause this issue because it is using jquery version 1.7.2. Our plugin is based on the WordPress built-in version of jquery which is 1.12. You can deactivate jQuery that is included with Cherry framework and request a compatible version for WordPress from the Google CDN. Here are the instructions:

    You have to make folder called site-specific-plugin-adjust-cherry-jquery and in it make file site-specific-plugin-adjust-cherry-jquery.php with content:

    <?php
    /*
    Plugin Name: Update jQuery Cherry framework
    Description: Deactivate jQuery that is included with Cherry framework and request a compatible version for WordPress from the Google CDN
    */
    /* Begin Adding Functions Below This Line */
    
    // Remove themes old version of jQuery and load a compatible version add_action('wp_enqueue_scripts', 'update_jquery_for_cherry_framework', 11);
    function update_jquery_for_cherry_framework() {
        wp_deregister_script('jquery');
        wp_register_script('jquery', '/wp-includes/js/jquery/jquery.js', false, false, true);
        wp_enqueue_script('jquery');
    }
    /* Stop Adding Functions */

    - Upload to wp-content/plugins using your preferred SFTP or FTP client. FileZilla and Cyberduck are free options that are available for multiple platforms.
    - Go to WP-admin (your WP dashboard) --> Plugins. Then locate the plugin in the list and click on Activate.

    Note: this will not install through WP-admin --> Plugins. It must be manually installed as described above.

    Permalink
    Was this answer helpful ?

    Yes No
    Viewed 13675 Times
  • 16. How to allow logged out users to upload attachments?
     

    By default WordPress does not allow this. Reason is: logged out user has no ID (id is 0), and no permissions/capabilities enabled for him.

    A solution would be to create an actual user that will be used as a single user for all logged-out users, and copy his ID (e.g. id = 100).

    Then you can add a simple hook to identify logged out users as User with ID 100. To do this you can use a hook like this:

        function set_loggedout_id( $user_id ){
           if( empty( $user_id ) ){
              $user_id = 100;
           }
           return $user_id;
        }
                
        add_filter( 'determine_current_user', 'set_loggedout_id', 999, 1 );
    

    Basically, it "tells" WordPress to replace the empty ID of a logged out user with a value of 100.
    Then you can allow uploading for this user.

    Permalink
    Was this answer helpful ?

    Yes No
    Viewed 14012 Times
  • 17. How to allow my front-end users to upload attachments in front-end uploader?
     

    By default, WordPress Media Library (used for attachments) allows file uploads only for users who have the upload_files capability. So, everyone who doesn't have this capability (e.g. a subscriber) will receive an error on trying to upload a file.

    To add this capability to subscribers you can e.g. use the User Role Editor plugin. Just enable the upload_files capability for the users which need it and it will work.

    Other option is to add this capability dynamically via a hook. To do this you can add e.g. this code to your theme's functions.php:

                function give_permissions( $allcaps, $cap, $args ) {
                    $allcaps['upload_files'] = true;
                    return $allcaps;
                }
                add_filter( 'user_has_cap', 'give_permissions', 0, 3 );     
    

    Basically, it enables the upload_files capability to everyone - but you can extend this logic to allow it only for certain users at certain moments.

    Permalink
    Was this answer helpful ?

    Yes No
    Viewed 19159 Times
  • 18. I added a table on page but see no style, sorting, filtering or pagination
     
    • Please check is there are no JS errors in the javascript console. Please check e.g. in Chrome JS console. Usually when we investigate such things we find out that some other plugin or theme are broken, and wpDataTables JS cannot execute.
    • Try to turn off option Include bootstrap on front-end in main settings of plugin.
    • Please try switching the theme to a different one and see if it helps.
    • Feel free to open a support ticket, providing us with the URL of the page so we could tell why does it happen.
    Permalink
    Was this answer helpful ?

    Yes No
    Viewed 14225 Times
  • 19. Why can't I connect to PostgreSQL separate DB connection?
     

    If your PostgreSQL is installed on Ubuntu 18.04 server, and you're receiving the following error:

    "wpDataTables could not connect to postgresql server. postgresql said: There was a problem with your SQL connection - could not find driver"

    You may need to install PGSQL driver by following these steps:

    [sudo] apt-get install php-pgsql
    

    Then uncomment pgsql and pdo-pgsql extentions in php.ini and restart Apache with the following command:

    [sudo] /etc/init.d/apache2 restart
    
    Permalink
    Was this answer helpful ?

    Yes No
    Viewed 12586 Times
  • 20. How can I filter CURL options in wpDataTable?
     

    If you have an SSL certificate, and you're having issues with tables linked to Google Spreadsheets, or if you're creating tables linked to JSON files which require authorization, instead of modifying the code of wpDataTables (which would be overwritten with every update), you can use our hook "wpdatatables_curl_get_data".

    For JSON files, please take a look at the commented example for authentication. The custom code should be added to functions.php file of your theme, or the child theme.

    function filterCURLOptions($data, $ch, $url){
        //
        // $data (null) is set to null if there are available filter
        //
        // $ch cURL handle returned by curl_init().
        //
        // $url (string) is URL of existing source(JSON, Google Sheet or PHP serialized array)
        //
        // Here you will insert your logic, because there are different JSON authentication
        // https://www.php.net/manual/en/function.curl-setopt.php
        //
        // Please note that this function is used for creating tables from JSON,Google sheets and PHP serialezed array
        // So you will need to filter it with some if statement based on $url parametar
        // 
        // Useful links
        //
        // https://stackoverflow.com/questions/30426047/correct-way-to-set-bearer-token-with-curl
        // https://stackoverflow.com/questions/60183353/php-how-to-make-a-get-request-with-http-basic-authentication
        // https://stackoverflow.com/questions/44331346/php-api-call-with-curl-and-authentication/44332142
        // https://stackoverflow.com/questions/2140419/how-do-i-make-a-request-using-http-basic-authentication-with-php-curl
        
        // Your code....
       
        return $data;
    }
    add_filter('wpdatatables_curl_get_data','filterCURLOptions', 10, 3);


    The following code is an example which is used for SSL of Google Spreadsheets:

    function filterCURLOptions($data, $ch, $url){
            curl_close($ch);
            $new_ch = curl_init();
            $timeout = 5;
            $agent = 'Mozilla/5.0 (Windows NT 6.2; WOW64; rv:17.0) Gecko/20100101 Firefox/17.0';
            curl_setopt($new_ch, CURLOPT_URL, $url);
            curl_setopt($new_ch, CURLOPT_RETURNTRANSFER, 1);
            curl_setopt($new_ch, CURLOPT_SSL_VERIFYHOST, false);
            curl_setopt($new_ch, CURLOPT_SSL_VERIFYPEER, false);
            curl_setopt($new_ch, CURLOPT_CONNECTTIMEOUT, $timeout);
            curl_setopt($new_ch, CURLOPT_USERAGENT, $agent);
            curl_setopt($new_ch, CURLOPT_REFERER, site_url());
            curl_setopt($new_ch, CURLOPT_FOLLOWLOCATION, true);
            $data = curl_exec($new_ch);
                if (curl_error($new_ch)) {
                    $error = curl_error($new_ch);
                    curl_close($new_ch);
                    wp_die($error);
                }
                if (strpos($data, '')) {
                   wp_die(__('wpDataTables was unable to read your Google Spreadsheet, probably it is not published correctly. 
     You can publish it by going to File -> Publish to the web ', 'wpdatatables'));
                }
                $info = curl_getinfo($new_ch);
                curl_close($new_ch);
                if ($info['http_code'] === 404) {
                    return NULL;
                }
       
        return $data;
    }
    add_filter('wpdatatables_curl_get_data','filterCURLOptions', 10, 3);
    

    This will work for tables made from Google Spreadsheets (regular method, not tables created with Google Sheets API), JSON files and Serialized PHP Arrays.

    Permalink
    Was this answer helpful ?

    Yes No
    Viewed 9703 Times
  • 1. How can I hide columns in the table?
     

    First option would be to click on “Column settings” buttons which you can find in header of every column in “Table preview and columns setup” section.
    After that Column settings modal will open and, under “Display” tab, you can find “Visible on front-end” option.

    Second option would be to click on “Complete column list” button wpDataTables complete column list to open a modal where you can quickly access some column settings.
    In the modal you can click on show/hide icon to toggle visibility for each column.

    It is recommended that if you don’t need certain columns to remove it from data source or select query for mysql tables if possible.
    It will speed up loading of the page and result in more clear look of column setup section.

    Permalink
    Was this answer helpful ?

    Yes No
    Viewed 15879 Times
  • 2. I can't find option Group column in column settings?
     

    We guess you created tables with server-side processing where this option is disabled. The reason for this is that when it is turn on with server-side processing, row grouping works, but other features of the plugin can have unexpected behavior.

    Permalink
    Was this answer helpful ?

    Yes No
    Viewed 14302 Times
  • 3. How to disable opening links in a popup and make it like button?
     

    In wpDataTables 2.1 and higher, additional settings for URL link columns are available:

    1. You can configure how the link should be opened - in the new tab or in the same tab.
    2. This option allows you to display the link as a button.
    3. You can set the button display text.
    4. You can set the button CSS class.

    URLlinkcolumn

    Permalink
    Was this answer helpful ?

    Yes No
    Viewed 15387 Times
  • 4. How to add text before/after column values without affecting sorting?
     

    In wpDataTables column settings for every column there are text fields “Cell content prefix” and “cell content suffix”.
    Values from those text fields will be used for adding text before or/and after every cell content in a column.
    This feature uses CSS for displaying entered text, therefore sorting of the columns will not be affected.

    Permalink
    Was this answer helpful ?

    Yes No
    Viewed 14963 Times
  • 5. How can I increase the number of filtering values in Select-box and Multiselect-box?
     

    If you have a column which contains more than 10 values, you may need to search through the filter to find the correct filtering option. This happens because the number of possible values to load is set to "10", and if you want to show more data in that column's filter you need to open column settings, go to Data tab, and change the "Number of possible values to load" from "10" to "All", and you'll be able to see all entries.

    Permalink
    Was this answer helpful ?

    Yes No
    Viewed 13158 Times
  • 1. What is yours License Policy?
     

    License depends on subscription plan that you purchase:

    Basic - Full plugin that can be used only for one domain or project.

    If your multiple sites are sub-sites of the same domain, and apply to the same project, you can use one license.

    Pro - Full plugin that can be used for 3 domains.

    Developer - Full plugin that can be used on unlimited number of domains.

    The prices for these licenses can be found here, and they are based on either a yearly subscription, or a lifetime purchase (depending on what you choose) and all licenses include support and monthly updates the whole time the subscription lasts, unlimited tables, unlimited charts, conditional formatting and separate database support.

    If you cancel subscription after one year, plugin will still work properly and you will have all your settings. You will not receive new updates and you won't be able to submit tickets with our customer support.

    Permalink
    Was this answer helpful ?

    Yes No
    Viewed 15027 Times
  • 2. What covers included support?
     

    Included support covers help with bugs and general inquiries for the plugin features, but not writing custom code.
    As you're developing some custom solution if you need our assistance we can offer you our paid customization service.

    Please note that standard support does not include:

    - Customization services;
    - Installation services;
    - Writing MySQL queries;
    - Writing advanced CSS;
    - Resolving and debugging third-party software and hardware issues;
    - Preparing files and tables;
    - Skype, Teamviewer calls, Remote sessions or etc.
    Support with such requests can be provided on a paid basis.

    Permalink
    Was this answer helpful ?

    Yes No
    Viewed 13815 Times
  • 3. How customization flow looks like?
     

    Requirements and flow for the customization:
    - Customer request some custom work by providing detailed instructions about it and temporary WordPress admin credentials (if there is some example)
    - Our development team will estimate the price and time which depends on the complexity of the request and business logic of company is this will be implement in core of plugin
    - After the agreement, we are proceeding to the payment via PayPal
    - After received payment, customer provide us temporary WordPress admin credentials​ and we start working on that request

    Permalink
    Was this answer helpful ?

    Yes No
    Viewed 13561 Times
  • 4. Where Is My Purchase Code?
     

    You can take a look at our store https://store.tms-plugins.com/login where you can find your purchase code. When you make purchase of our plugin, you receive email with credentials for our store  which you can use for login.

    Permalink
    Was this answer helpful ?

    Yes No
    Viewed 14630 Times
  • 1. How to change color on pie chart(highcharts)?
     

    There is no built in option, but you can use wpdatachart callbacks. Every chart exposes several options that customize its look and feel. Charts usually support custom options appropriate to that visualization. You can use it for adding options that are available in Highcharts API. In this callback in method wpDataChartsCallbacks 15 is id of the chart which you want to change colors.We used hex color codes with some random colors, but you can change it for your needs. There are six of them(if you have six series) if you had it more then you have to add more colors in colors array, separated with comma(except last one). On the end insert this script above shortcode of your chart on page.

    <script type="text/javascript">
    jQuery(window).on('load',function(){
        if( typeof wpDataChartsCallbacks == 'undefined' ){ wpDataChartsCallbacks = {}; }
        wpDataChartsCallbacks[15] = function(obj){
            obj.options.plotOptions.pie = {
                colors: [
                        '#50B432',
                        '#ED561B',
                        '#DDDF00',
                        '#24CBE5',
                        '#64E572',
                        '#FF9655'
                ],
                dataLabels: {
                        format: '{point.name}{point.percentage:.1f} %'
               }
            }
        }
    });
    </script>
    

    Permalink
    Was this answer helpful ?

    Yes No
    Viewed 17424 Times
  • 2. How to remove dataLabels and add legend on pie chart (highcharts)?
     

    There is no built-in option, but you can use wpdatachart callbacks. Every chart exposes several options that customize its look and feel. Charts usually support custom options appropriate to that visualization. You can use it for adding options that are available in Highcharts API. In this callback in method wpDataChartsCallbacks 19 is the ID of the chart which you want to change. Insert this script above shortcode of your chart on the page.

    <script type="text/javascript">
    jQuery(window).on('load',function(){
        if( typeof wpDataChartsCallbacks == 'undefined' ){ wpDataChartsCallbacks = {}; }
        wpDataChartsCallbacks[16] = function(obj){
            obj.options.plotOptions = {
                series: {
                         dataLabels: {
                            enabled: false
                         }
                },
                pie: {
                      allowPointSelect: true,
                      cursor: 'pointer',
                      dataLabels: {
                           enabled: false
                      },
                      showInLegend: true
                }
            };
        };
    });
    </script>
    

    Permalink
    Was this answer helpful ?

    Yes No
    Viewed 16672 Times
  • 3. How to change color on pie chart (google chart)?
     

    There is no built-in option, but you can use wpdatachart callbacks. Every chart exposes several options that customize its look and feel. Charts usually support custom options appropriate to that visualization. You can use it for adding options that are available in Google Api. In this callback in method wpDataChartsCallbacks 83 is the ID of the chart which you want to change colors. We used hex color codes with some random colors, but you can change it for your needs. There are six of them (if you have six series), if you had it more then you have to add more colors in colors array, separated by a comma (except last one). On the end insert this script above shortcode of your chart on the page.

    <script type="text/javascript">
    jQuery(window).on('load',function(){
        if( typeof wpDataChartsCallbacks == 'undefined' ){ wpDataChartsCallbacks = {}; }
        wpDataChartsCallbacks[83] = function(obj){
            obj.options.colors = [
                         '#50B432',
                         '#ED561B',
                         '#DDDF00',
                         '#24CBE5',
                         '#64E572',
                         '#FF9655'
            ],
         obj.options.pieSliceText = "percentage"
        }
    });
    </script>

    Permalink
    Was this answer helpful ?

    Yes No
    Viewed 16559 Times
  • 4. Which chart types are available?
     

    wpDataTables includes 4 major chart engines:

    1. Google Charts;
    2. HighCharts;
    3. Chart.js;
    4. ApexCharts.

    Even though there are a lot of chart types in the aforementioned chart libraries, they need to be programmatically added by our developers, so not all chart types you see on chart engines' websites are included in wpDataTables. You can always suggest one of the missing chart types be developed for wpDataTables by clicking on this link.

    The list of available chart types for each engine can be seen in the tabs below. You can click on each image or each chart name to open a new page where you can see a live example of that chart type in our documentation.

    Please note: We develop new features and modify existing ones based on the number of votes on the feature suggestion page, linked above.

    Permalink
    Was this answer helpful ?

    Yes No
    Viewed 16139 Times
  • 5. How to change color on pie chart(chart.js)?
     

    There is no built-in option, but you can use wpdatachart callbacks. Every chart exposes several options that customize its look and feel. Charts usually support custom options appropriate to that visualization. You can use it for adding options that are available in Chart.js API. In this callback in method wpDataChartsCallbacks 82 is the ID of the chart for which you want to change colors. We used hex color codes with some random colors, but you can change it for your needs. There are six of them (if you have six series), if you had it more then you have to add more colors in colors array, separated by a comma (except last one). On the end insert this script above shortcode of your chart on the page.

    <script type="text/javascript">
    jQuery(window).on('load',function(){
        if( typeof wpDataChartsCallbacks == 'undefined' ){ wpDataChartsCallbacks = {}; }
        wpDataChartsCallbacks[82] = function(obj){
            obj.options.data.datasets[0].backgroundColor = [
                                                            '#50B432',
                                                            '#ED561B',
                                                            '#DDDF00',
                                                            '#24CBE5',
                                                            '#64E572',
                                                            '#FF9655'
            ]
        }
    });
    </script>

    Permalink
    Was this answer helpful ?

    Yes No
    Viewed 17209 Times
  • 6. How to change number format, change decimal separator and define decimal places in Column Chart (Highcharts)?
     

    Highcharts do not inherit the number format you set up in wpDataTables, and there are no built-in options to change the number format in the chart, but you can use wpdatachart callbacks. Every chart exposes several options that customize its look and feel. Charts usually support custom options appropriate to that visualization. You can use it for adding options that are available in Highcharts API.

    In this example we will show you how to use Highcharts.setOptions to change the decimal separator from point ( . ) to a comma ( , ). In the callback, you can see how to change the number of decimal places after the separator ( , ) from default 2 to 3. We use the method wpDataChartsCallbacks where 93 is the id of the chart for which we want to apply these settings.

    <script type="text/javascript">
    jQuery(window).on('load',function(){
        Highcharts.setOptions({
            lang: {
                decimalPoint: ','
            }
        });
        if( typeof wpDataChartsCallbacks == 'undefined' ){ wpDataChartsCallbacks = {}; }
        wpDataChartsCallbacks[93] = function(obj){
            obj.options.tooltip = {
                pointFormat: "Distance: {point.y:.3f} km"
            };
        };
    });
    </script>
    

    Permalink
    Was this answer helpful ?

    Yes No
    Viewed 14036 Times
  • 7. How to add labels on two Y axes (Highcharts)?
     

    If you add a prefix or a suffix to values in the table, they won't be carried over to the chart. This is the default behavior of the chart engine, but you can use wpdatachart callbacks to get them to display. Every chart exposes several options that customize its look and feel. Charts usually support custom options appropriate to that visualization. You can use it for adding options that are available in Highcharts API.

    In this example we will show you how to use Highcharts.setOptions to add these labels on a chart which has two Y axes.

    <script type="text/javascript">
    jQuery(window).on('load',function(){
        if( typeof wpDataChartsCallbacks == 'undefined' ){ wpDataChartsCallbacks = {}; }
        wpDataChartsCallbacks[94] = function(obj){
            obj.options.yAxis[0] = {
               labels: {
                 format: '$ {value}'
               }
            }
            obj.options.yAxis[1] = {
               opposite: true,
               labels: {
                 format: '{value} %'
               }
            }
        }
    });
    </script>
    

    Permalink
    Was this answer helpful ?

    Yes No
    Viewed 13417 Times
  • 8. How to remove percentage from a pie chart tooltip (Google Charts)?
     

    Percentage is being automatically added to Google Pie charts tooltips, and there is no built-in option to remove it. However, you can use wpDataChart callbacks to tweak this. Charts usually support custom options appropriate to that visualization. You can use it for adding options that are available in Google Api. In this callback in method wpDataChartsCallbacks 83 is the ID of the chart we want to remove the percentage from the tooltips.

    <script type="text/javascript"&gt
    jQuery(window).on('load',function(){
        if( typeof wpDataChartsCallbacks == 'undefined' ){ wpDataChartsCallbacks = {}; }
        wpDataChartsCallbacks[96] = function(obj){
            obj.options.tooltip = {
                        text: 'value'
            }
            obj.options.pieSliceText = "none"
        }
    });
    </script>
    

    Hover over the slices in the chart to see the change.

    Permalink
    Was this answer helpful ?

    Yes No
    Viewed 14445 Times
  • 9. How can I create a horizontal bar (column) chart using Chart.js?
     

    From plugin version 5.3, horizontal bar chart is available as option in chart wizard.

    By default chart engine's behavior, column chart cannot be inverted, so X axis becomes Y axis and vice versa. That's where wpDataCharts Callbacks come in again. Every chart exposes several options that customize its look and feel. Charts usually support custom options appropriate to that visualization. You can use it for adding options that are available in Charts.js API.

    In this example, we look at Global Smartphone Shipments (in millions of units) since Q3 2018, until Q3 2019. Initially, the chart would come up like this:

    To make the chart display the bars horizontally, you need to enter the following callback in HTML format above the chart's shortcode, like this:

    <script type="text/javascript">
    jQuery(window).on('load',function(){
        if( typeof wpDataChartsCallbacks == 'undefined' ){ wpDataChartsCallbacks = {}; } 
        wpDataChartsCallbacks[95] = function(obj) { 
            obj.options.type = 'bar';
            obj.options.options.indexAxis = 'y';
        };
    });
    </script>
    

    For a chart that has this many bars, it's recommended to change the default chart's height in the creation wizard. So with the height set to 800px, and the callback seen above applied, the chart finally looks like this:

    Permalink
    Was this answer helpful ?

    Yes No
    Viewed 13500 Times
  • 1. Can I try wpdatatables before purchase?
     

    We created a Sandbox site so that you could try our WordPress table plugin before you buy it. It has a number of pre-defined WordPress tables illustrating the plugin features, and you're free to create a table in WordPress and see how the plugin works.

    Also is available free wpDataTables Lite version of the plugin. While some of the premium features are reduced, wpDataTables Lite is still quite a handy tool which would allow you to quickly create tables in WordPress from different sources: Excel, CSV, JSON, XML and Serialized PHP array.

    Permalink
    Was this answer helpful ?

    Yes No
    Viewed 14480 Times
  • 1. How to use URL parameters for filtering?
     

    Tables can be filtered with a query string that consists of “wdtColumnFilter[KEY]” value pairs where KEY is a zero-based numerical index of the column you would like to filter or initial column header. For example:

    ?wdt_column_filter[1]=Asia&wdt_column_filter[country]=Thailand

    Values passed from URL will be used as default filter values, therefore “Advanced filtering” option needs to be enabled on table edit page.

    If you need to pre-filter the table via global search just open the page adding a key to the URL:

    ?wdt_search=filtervalue

    Where ‘filtervalue’ is the value you would like to insert into the filtering field. This would pre-filter the table via global search.

    Permalink
    Was this answer helpful ?

    Yes No
    Viewed 17446 Times
  • 2. How to filter table by invisible columns?
     

    If you like to have invisible columns in filters, that can be achieved by enabling “Filter in form” option in table edit page.
    “Filter in form” option will create filters as a separate section from the table and additionally show filters for all hidden columns.
    You can choose which column filter will be visible/hidden by unchecking/checking the "Add a filter for this column" button in the column settings for the desired column.

    Permalink
    Was this answer helpful ?

    Yes No
    Viewed 15577 Times
  • 3. Can I change position of column filters?
     

    In order to show column filters in a table, you have “Render advanced filter” option where you can choose options “In the header” and “In the footer” on the wpDataTables Settings page.

    If you need to show column filters outside of the table you can do that with option Filter in form. To use it you need to go to the “Sorting and Filtering” tab in the table settings, first enable “Advanced column filters”, and then enable the “Filter in form”.

    "Advanced filter in a widget" (in WordPress sidebar) is one more way with which you can use column filters outside of the table. This way you can define the region of the page where to render the filtering form. More about this and about Advanced filters you can find on this link.

    Permalink
    Was this answer helpful ?

    Yes No
    Viewed 14998 Times
  • 4. How to show/hide table column filters?
     

    For showing and hiding column filters is responsible “Advanced column filters” option on the table settings page.
    You can also hide each column filter in column settings by unchecking the “Add a filter for this column” button in Filtering tab for desired column.
    By checking or unchecking this settings check box and saving, table will show or hide column filters.

    Permalink
    Was this answer helpful ?

    Yes No
    Viewed 17320 Times
  • 5. How can I increase the number of filtering values in Select-box and Multiselect-box?
     

    If you have a column which contains more than 10 values, you may need to search through the filter to find the correct filtering option. This happens because the number of possible values to load is set to "10", and if you want to show more data in that column's filter you need to open column settings, go to Data tab, and change the "Number of possible values to load" from "10" to "All", and you'll be able to see all entries.

    Permalink
    Was this answer helpful ?

    Yes No
    Viewed 13158 Times
  • 1. Is it possible to adjust the pdf export settings so the table can be in landscape rather than portrait orientation?
     

    Yes you can do that by changing some code. Open file ../wp-content/plugins/wpdatatables/source/class.wpdatatable.php and around line 3315 you will find this:

    'orientation' => 'portrait',
    

    Just replace it with this:

    'orientation' => 'landscape',
    
    Permalink
    Was this answer helpful ?

    Yes No
    Viewed 14456 Times
  • 2. How to change position of wpdatatables blocks (info, search, paginate and rows per page)?
     

    When customizing wpDataTables for your own usage, you might find that the default position of those elements is not quite to your liking. You have to modify some code in the core of the plugin.

    Example to move info block above the table is to edit the plugin file. In file ../wp-content/plugins/wpdatatables/source/class.wpdatatable.php around line 3515 find:

    $obj->dataTableParams->sDom = "BT'clear'>{$showRowsPerPage}{$globalSearch}{$scrollable}{$infoBlock}{$pagination}";

    and replace it with:

    $obj->dataTableParams->sDom = "B{$infoBlock}T'clear'>{$showRowsPerPage}{$globalSearch}{$scrollable}{$pagination}";
    

    If you want info block at the top and bottom of the grid, replace it with:

    $obj->dataTableParams->sDom = "B{$infoBlock}T'clear'>{$showRowsPerPage}{$globalSearch}{$scrollable}{$infoBlock}{$pagination}";

    each letter stands for the different block. Our plugin is based on Datatables jQuery plugin and more details about DOM positioning can be found on this link.

    Note: If you make these changes, they will be overwritten with the next update, so you will need to make the changes again.

    Permalink
    Was this answer helpful ?

    Yes No
    Viewed 15868 Times
  • 3. How to create the Cryptocurrencies rank table?
     

    The Cryptocurrencies rank table is a manual table, so we start by creating a manual table with 10 columns (one integer, and 9 string-type columns). We're using the "Aqua" skin for our tables, but you're welcome to try other skins as well.

    The table settings are:

    Display tab:

    Sorting and Filtering tab:

    Editing tab:

    Table Tools tab:

    Placeholders tab is not being used in this case, so whatever data you have in those fields should not be changed.

    1. First Column ( "#" ) - Only this column is an integer column, which is used as the default sorting column for the table. When creating the column, you need to enter a different name, though (in our case it's "rd"), because "#" cannot be stored in the database, so simply set the displayed header to "#":

    Settings for this column are:

    Display tab:

    • "Visible on front-end" enabled
    • "Column width" set to "100"

    Sorting tab - Like mentioned before, this column is used as the default sorting column for the table:

    Filtering for this column is enabled, and we added a label to the filter - "Position":

    Editing has been enabled, and Editor-input type is set to "One-Line edit", so you can enter data in back-end when creating the table.

    There is no Conditional Formatting applied to this column.

    2. Second column ( "Name" ) - This is a string column which requires some work. First, we open column settings and apply the following in the Display tab:

    Here we've defined the column width to be 200px (please note that this is only possible if you enable Limit table width in table settings above the table), and added a CSS class "cripto-div", which is used to vertically center the cells of this column. To define the CSS class, you will need to go to wpDataTables settings/Custom JS and CSS/Custom CSS, and add the following to the Custom CSS field:

    .cripto-div {
       vertical-align: middle;}
    .cripto-div span {font-size: 16px;font-weight: 600;margin-left: 5px;vertical-align: top !important;margin-top: 6px;}

    The cryptocurrencies' icons are all stored in a single .png file, which you can access on this link. You need to add a CSS class in Custom CSS field to be able to access the image:

    .cripto-sprite {display: inline-block;margin: 0 2px;background-image: url(https://wpdatatables.com/wp-content/uploads/2018/12/cripto-sprite.png);width: 16px;height: 16px;}
    .cripto-sprite{
        background-image: url(https://wpdatatables.com/wp-content/uploads/2019/02/Artboard.png);
        background-repeat: no-repeat;
        background-size:160px;
        width: 32px;
        height: 32px;
        margin-left:0 !important;
    }
    

    To access these icons individually, and add them in rows you need to add a CSS class which would locate the icon's position in that .png file - to specify the coordinates, so to speak. To do that, you need to add a new class for every cryptocurrency. For example, the icon coordinates for Bitcoin are accessed with the following CSS:

    .cripto-1{background-position: -734px -207px;}

    Since we have 20 cryptocurrencies in that table, the full coordinates CSS which you need to add in Custom CSS field would look like this:

    .cripto-1{background-position: -734px -207px;}
    .cripto-1{background-position: -734px -207px;}
    .cripto-2{background-position: -176px -64px;}
    .cripto-3{background-position: -734px -48px;}
    .cripto-4{background-position: -416px -639px;}
    .cripto-5{background-position: -176px -96px;}
    .cripto-7{background-position: -16px -96px;}
    .cripto-8{background-position: -638px -557px;}
    .cripto-9{background-position: -238px -160px;}
    .cripto-10{background-position: -464px -623px;}
    .cripto-11{background-position: -638px -399px;}
    .cripto-12{background-position: -192px -655px;}
    .cripto-13{background-position: -16px -336px;}
    .cripto-14{background-position: -304px -639px;}
    .cripto-15{background-position: -400px -687px;}
    .cripto-16{background-position: -32px -80px;}
    .cripto-17{background-position: -480px -463px;}
    .cripto-18{background-position: -128px -687px;}
    .cripto-19{background-position: -718px -64px;}
    .cripto-20{background-position: -702px -395px;}
    
    .cripto-1 {
    background-position: 0 0;
    }
    .cripto-2 {
    background-position: -32px 0;
    }
    .cripto-3 {
    background-position: -64px 0;
    }
    .cripto-4 {
    background-position: -96px 0;
    }
    .cripto-5 {
    background-position: -128px 0;
    }
    .cripto-6 {
    background-position: 0 -32px ;
    }
    .cripto-7 {
    background-position: -32px -32px;
    }
    .cripto-8 {
    background-position:  -64px -32px;
    }
    .cripto-9 {
    background-position: -96px -32px;
    }
    .cripto-10 {
    background-position:-128px -32px;
    }
    .cripto-11 {
    background-position: 0 -64px;
    }
    .cripto-12 {
    background-position: -32px -64px;
    }
    .cripto-13 {
    background-position: -64px -64px;
    }
    .cripto-14 {
    background-position:  -96px -64px;
    }
    .cripto-15 {
    background-position:  -128px -64px;
    }
    .cripto-16 {
    background-position: 0 -96px;
    }
    .cripto-17 {
    background-position:  -32px -96px;
    }
    .cripto-18 {
    background-position:  -64px -96px;
    }
    .cripto-19 {
    background-position: -96px -96px;
    }
    .cripto-20 {
    background-position: -128px -96px;
    }
    

    Then, when you edit the first row, you need to enter the following code, so the image is pulled and added in front of "Bitcoin" in that row:

    <div class="cripto-1 cripto-sprite"></div>Bitcoin

    Which would look like this in the edit modal:

    So, to apply this for each row individually, you should add them in the edit modal one at a time using the lines of code below:

    <div class="cripto-1 cripto-sprite"></div>Bitcoin
    <div class="cripto-2 cripto-sprite"></div>XRP
    <div class="cripto-3 cripto-sprite"></div>Ethereum
    <div class="cripto-4 cripto-sprite"></div>Bitcoin Cash
    <div class="cripto-5 cripto-sprite"></div>Stellar
    <div class="cripto-6 cripto-sprite"></div>EOS
    <div class="cripto-7 cripto-sprite"></div>Tether
    <div class="cripto-8 cripto-sprite"></div>Litecoin
    <div class="cripto-9 cripto-sprite"></div>Bitcoin SV
    <div class="cripto-10 cripto-sprite"></div>TRON
    <div class="cripto-11 cripto-sprite"></div>Cardano
    <div class="cripto-12 cripto-sprite"></div>IOTA
    <div class="cripto-13 cripto-sprite"></div>Monero
    <div class="cripto-14 cripto-sprite"></div>Binance Coin
    <div class="cripto-15 cripto-sprite"></div>Dash
    <div class="cripto-16 cripto-sprite"></div>NEM
    <div class="cripto-17 cripto-sprite"></div>Ethereum Classic
    <div class="cripto-18 cripto-sprite"></div>NEO
    <div class="cripto-19 cripto-sprite"></div>Waves
    <div class="cripto-20 cripto-sprite"></div>Zcash
    

    That covers the creation of the second column, and filling out its data.

    3. Columns 3 - 10 all have the same CSS class applied to them - "aligncentarcell". Go ahead, and apply this class in column settings for columns 3 - 10:

    This class aligns the text horizontally in the center, using the following CSS:

    .wpDataTablesWrapper table.wpDataTable td.aligncentarcell, 
    .wpDataTablesWrapper table.wpDataTable th.aligncentarcell
    { text-align: center !important; }
    

    With this, you will have completed the custom setup of columns #3, #4 and #6 ( "Symbol", "Market Cap" and "Circulating Supply" ).


    Third column ( "Symbol" ) - column settings:

    Display tab:

    • "Visible on front-end" enabled

    Data tab: keeps default settings.

    Sorting tab: Sorting is allowed.

    Filtering tab: Filtering is allowed, filter type set to "Checkbox", with no labels applied, no exact filtering, no pre-defined filter values, and filters are rendered in modal form.

    Editing tab: One-line edit.

    There is no Conditional Formatting applied to this column.


    Fourth column ( "Market Cap" ) and sixth column ( "Circulating Supply" ) - columns settings are the same:

    Display tab:

    • "Visible on front-end" enabled
    • "Hide on mobiles" enabled
    • "Hide on tablets" enabled

    Data tab: keeps default settings.

    Sorting tab: Sorting is allowed.

    Filtering tab: Filtering is allowed, filter type set to "Text", with no labels applied, no exact filtering, no pre-defined filter values, and filters are rendered in modal form.

    Editing tab: One-line edit.

    There is no Conditional Formatting applied to these columns.


    4. Since we already saved the "aligncentarcell" CSS class for the Fifth Column ( "Price" ), we need to add some Conditional Formatting to it. It uses only one rule:

    This rule tells the table to call the "blue-text" CSS class when the cell value contains a dot ( . ). The CSS you need to apply in Custom CSS field is:

    .blue-text{color: #0083c2  !important;}
    

    The same CSS class will be used for the seventh column, but we'll get to that after we go through settings for the fifth column:

    Display tab:

    • "Visible on front-end" enabled
    • "Hide on mobiles" enabled
    • "Hide on tablets" enabled

    Data tab: keeps default settings.

    Sorting tab: Sorting is allowed.

    Filtering tab: Filtering is allowed, filter type set to "Text", with no labels applied, no exact filtering, no pre-defined filter values, and filters are rendered in modal form.

    Editing tab: One-line edit.


    5. The seventh column ( "Volume" ) has settings similar to the "Price" column, but with a comma ( , ) instead of a dot ( . ) applied in the conditional formatting rule, so:

    This rule tells the table to call the "blue-text" CSS class when the cell value contains a comma ( , ). Since the CSS class is already entered, there's no need to repeat the process.

    Display tab:

    • "Visible on front-end" enabled
    • "Hide on mobiles" enabled
    • "Hide on tablets" enabled

    Data tab: keeps default settings.

    Sorting tab: Sorting is allowed.

    Filtering tab: Filtering is allowed, filter type set to "Text", with no labels applied, no exact filtering, no pre-defined filter values, and filters are rendered in modal form.

    Editing tab: One-line edit.


    6. Columns #8, #9 and #10 ( "% 1h", "% 24h" and "$ 7d" ) have the same set up with only one difference:

    Custom column width of "90" is applied in the Display tab when you access the column settings for columns #8 and #10, while column #9 has the custom width set to "100". All other settings are the same for these three columns - there are a couple of Conditional Formatting rules applied:

    These rules tell the table to paint the values of a cell in red if there is a minus sign ( - ) present in that cell, and to paint the values in green if the sign is not present. So, we need to add a couple more CSS classes:

    .red-text{color: #d94040 !important;}
    .green-text{color: #009e73 !important;}
    

    Same column settings apply to all three columns:

    Display tab:

    • "Visible on front-end" enabled
    • "Hide on mobiles" enabled
    • "Hide on tablets" enabled

    Data tab: keeps default settings.

    Sorting tab: Sorting is allowed.

    Filtering tab: Filtering is allowed, filter type set to "Text", with no labels applied, no exact filtering, no pre-defined filter values, and filters are rendered in modal form.

    Editing tab: One-line edit.


    That completes the creation of the Cryptocurrencies rank table, and if you followed the tutorial closely, you should have the same table in your database now.

    Permalink
    Was this answer helpful ?

    Yes No
    Viewed 13814 Times
  • 4. How to create the Pricing table example #3?
     

    All pricing tables shown on the Pricing examples page are Simple Tables. Example #3 is created by adding this in 3 cells:

    Cell 1:

    <div class="panel">
    <h3 class="h2">STARTER</h3>
    <ul class="list-unstyled">
    <li class="price"><span class="h3 color-primary">$49</span></span></li>
    </ul>
    <p class="website">1 Webiste / YEAR</p>
    <ul class="features list-unstyled">
    <li><div class="checkmark checkmark-black"></div>Plugin Updates</li>
    <li><div class="checkmark checkmark-black"></div>100+ Templates</li>
    <li><div class="checkmark checkmark-black"></div>55+ Field Types</li>
    <li><div class="checkmark checkmark-black"></div>PRO Actions</li>
    <li><div class="checkmark checkmark-black"></div>Conditional Logic</li>
    <li><div class="checkmark checkmark-black"></div>Calculated Fields</li>
    <li><div class="checkmark checkmark-black"></div>Extend with Add-Ons</li>
    <li><div class="checkmark checkmark-black"></div>Professional Support</li>
    <li></li>
    </ul>
    <a href="https://wpdatatables.com/pricing" target="_blank" class="button primary full">Buy now</a>
    </div>
    

    Cell 2:

    <div class="panel middle">
    <div class="panel middle">
    <h3 class="h2 middle">FREELANCE<span class="best-value">Best Value</span></h3>
    <ul class="list-unstyled">
    <li class="price"><span class="h3 color-middle">$99</span></li>
    </ul>
    <p class="website">10 Webistes / YEAR</p>
    <ul class="features list-unstyled">
    <li><div class="checkmark checkmark-white"></div>Plugin Updates</li>
    <li><div class="checkmark checkmark-white"></div>100+ Templates</li>
    <li><div class="checkmark checkmark-white"></div>55+ Field Types</li>
    <li><div class="checkmark checkmark-white"></div>PRO Actions</li>
    <li><div class="checkmark checkmark-white"></div>Conditional Logic</li>
    <li><div class="checkmark checkmark-white"></div>Calculated Fields</li>
    <li><div class="checkmark checkmark-white"></div>Extend with Add-Ons</li>
    <li><div class="checkmark checkmark-white"></div>Professional Support</li>
    <li></li>
    </ul>
    <a target="_blank" href="https://wpdatatables.com/pricing" class="button primary full">Buy now</a>
    </div>
    

    Cell 3:

    <div class="panel">
    <h3 class="h2">PROFESSIONAL</h3>
    <ul class="list-unstyled">
    <li class="price"><span class="h3 color-primary">$299</span></li>
    </ul>
    <p class="website">1000 Webistes / YEAR</p>
    <ul class="features list-unstyled">
    <li><div class="checkmark checkmark-black"></div>Plugin Updates</li>
    <li><div class="checkmark checkmark-black"></div>100+ Templates</li>
    <li><div class="checkmark checkmark-black"></div>55+ Field Types</li>
    <li><div class="checkmark checkmark-black"></div>PRO Actions</li>
    <li><div class="checkmark checkmark-black"></div>Conditional Logic</li>
    <li><div class="checkmark checkmark-black"></div>Calculated Fields</li>
    <li><div class="checkmark checkmark-black"></div>Extend with Add-Ons</li>
    <li><div class="checkmark checkmark-black"></div>Professional Support</li>
    <li></li>
    </ul>
    <a href="https://wpdatatables.com/pricing" target="_blank" class="button primary full">Buy now</a>
    </div>

    This gives you the not-so-pretty simple table:

    To get the appearance of the table you see on this page, you need to add some custom CSS to the page on the front-end:

    #wpdtSimpleTable-177 td .panel {
        background-color: #FFFFFF;
        border: none;
        display: block;
        height: 100%;
        padding: 20px;
        border-radius: 24px;
        position: relative;
        color: #000000;
        box-shadow: 0 25px 18px -11px rgba(0, 0, 0, .1);
        transition: all .35s;
        margin:0;
    }
    #wpdtSimpleTable-177 td .panel:hover {
        transition: all .35s;
        transform: translate3d(0, -2px, 0);
        box-shadow: 0 25px 18px -11px rgba(0, 0, 0, .1);
    }
    #wpdtSimpleTable-177 td .panel.middle {
        background-color: #091d70;
        border: none;
        color: #fff;
        display: block;
        height: 100%;
        padding: 20px;
        position: relative;
    }
    #wpdtSimpleTable-177 td h3.h2 {
        margin: 0 !important;
        font-weight: 700;
        font-size: 20px;
        padding: 10px;
        line-height: 60px;
        letter-spacing: 3px;
        color: #000000;
    }
    #wpdtSimpleTable-177 td h3.h2.middle {
        color: #FFFFFF;
    }
    #wpdtSimpleTable-177 td .h3 {
        font-size: 98px;
        font-style: normal;
        font-weight: 400;
        line-height: 1;
        letter-spacing: -4px;
        color: #003180;
    }
    #wpdtSimpleTable-177 td .h3.middle {
        font-size: 68px;
        font-style: normal;
        font-weight: 500;
        line-height: 1;
        letter-spacing: -4px;
    }
    #wpdtSimpleTable-177 td ul {
        margin: 0 0 20px;
    }
    #wpdtSimpleTable-177 td .list-unstyled {
        list-style: none;
        padding-left: 0;
    }
    #wpdtSimpleTable-177 td .price {
        margin-top: 20px;
        text-align: center;
        color: #003180;
    }
    #wpdtSimpleTable-177 td .price .color-middle {
        color: #FFFFFF;
    }
    #wpdtSimpleTable-177 .checkmark-black,
    #wpdtSimpleTable-177 .checkmark-blue,
    #wpdtSimpleTable-177 .checkmark-white {
        margin-right: 20px;
    }
    #wpdtSimpleTable-177 .website {
        font-style: normal;
        font-weight: 500;
        font-size: 20px;
        line-height: 24px;
        text-align: center;
        text-transform: uppercase;
        letter-spacing: 0;
        mix-blend-mode: normal;
        opacity: .8;
        margin-top: 52px;
        margin-bottom: 32px !important;
    }
    #wpdtSimpleTable-177 td .button {
        margin: 32px auto 16px;
        background: #008cff;
        color: #fff;
        line-height: 1;
        padding: 2rem 4rem;
        display: block;
        cursor: pointer;
        box-shadow: none;
        transition: all .35s;
        font-size: 2rem;
        border: none;
        overflow: visible;
        vertical-align: middle;
        text-align: center;
        text-decoration: none;
        border-radius: 28px;
    }
    #wpdtSimpleTable-177 td .features {
        display: table;
        margin: 0 auto;
        text-align: left;
    }
    #wpdtSimpleTable-177 td .features li {
        font-size: 16px;
        opacity: .8;
    }
    #wpdtSimpleTable-177 {
        border-collapse: separate;
        border-spacing: 20px;
    }
    #wpdtSimpleTable-177 td {
        border: none !important;
        box-shadow: 0 20px 50px 0 rgba(28, 9, 80, .07);
        border-top-right-radius: 5px;
        border-top-left-radius: 5px;
        background-color: transparent;
        height:auto;
    }
    #wpdtSimpleTable-177 .best-value {
        color: #af7a22;
        background-color: #ffd850;
        font-style: normal;
        font-weight: 700;
        font-size: 12px;
        line-height: 15px;
        vertical-align: middle;
        text-align: center;
        letter-spacing: normal;
        max-width: 82px;
        margin-left: 5px;
        margin-right: auto;
        margin-top: 7px;
        padding: 2px 6px;
        border-radius: 13px;
    }
    @media only screen and (max-width: 1440px) {
        #wpdtSimpleTable-177 .best-value {
            position: absolute;
            top: -5px;
            margin-left: auto;
            margin-right: auto;
            left: 0;
            right: 0;
            text-align: center;
        }
        #wpdtSimpleTable-177 td .h3 {
            font-size: 60px;
        }
        #wpdtSimpleTable-177 td h3.h2 {
            font-size: 15px;
        }
        #wpdtSimpleTable-177 td .features li {
            font-size: 14px;
        }
        #wpdtSimpleTable-177 td .h2.middle {
            position: relative;
        }
        #wpdtSimpleTable-177 .website {
            font-size: 15px;
        }
        #wpdtSimpleTable-177 .checkmark-black,
        #wpdtSimpleTable-177 .checkmark-blue,
        #wpdtSimpleTable-177 .checkmark-white {
            margin-right: 20px;
            margin-left: 0px;
        }
        #wpdtSimpleTable-177 td .panel,
        #wpdtSimpleTable-177 td .panel.middle {
            padding:10px;
        }
        #wpdtSimpleTable-177 td .button {
            padding: 1rem 3rem;
            font-size: 2rem;
        }
        #pricing-table-example-three .wdt-res-wrapper.active{
            max-height: initial;
        }
        #wpdtSimpleTable-177.bt td .button {
            padding: 3rem;
            font-size: 4rem;
        }
        #wpdtSimpleTable-177.bt tr{
            border:none;
        }
        #wpdtSimpleTable-177.bt td {
            margin-bottom: 20px;
        }
    }

    Just make sure to replace the #wpdtSimpleTable-177 with the actual ID of your table.

    Permalink
    Was this answer helpful ?

    Yes No
    Viewed 18063 Times
  • 5. How to create Amazon product comparison table #1
     

    In this example, we'll show you how to create the 1st example of the Amazon Product Comparison table, as shown here.

    What you need to know about this table type:

    • This is a Simple Table.
    • Columns that contain images, icons, or URLs all contain some CSS
    • Custom CSS will need to be added to the page
    • You will need to replace the ID of the table with the ID of your table

    Generate the table by clicking on wpDataTables/Create a Table/Create a Simple Table from Scratch

    create-simple-table

    On the next screen, create a table with 4 columns and 29 rows.

    columns-rows-simple

    The 1st column contains simple text data where some of the data is enclosed in "span" with the class "h" for underlined cells. Only cells that mention that the color was changed were actually modified using the built-in table tools.

    There's no need for any styling since we'll add CSS later to the page.

    1st row:

    Column 1:

    <span class="h">Preview</span>

    Column 2:

    <img src="https://wpdatatables.com/wp-content/uploads/2021/10/huawei40PRO.png" alt="" width="150" height="143" />

    Column 3:

    <img src="https://wpdatatables.com/wp-content/uploads/2021/10/SamsungS20Ultra.png" alt="" width="120" height="114" />

    Column 4:

    <img src="https://wpdatatables.com/wp-content/uploads/2021/10/XiaomiMi10.png" alt="" width="120" height="151" />

    2nd row:

    Column 1:

    <span class="h">Model</span>

    Column 2: Huawei P40 Pro

    Column 3: Samsung Galaxy S20 Ultra

    Column 4: Xiaomi Mi 10

    3rd row:

    Column 1:

    <span class="h">Price</span>

    Column 2:

    <span class="price">$804</span>

    Column 3:

    <span class="price">$599</span>

    Column 4:

    <span class="price">$365</span>

    4th row:

    Column 1:

    <span class="h">Score</span>

    Colums 2, 3, and 4 are blank.

    5th row:

    Column 1 has text color set to rgba(167, 167, 177, 1): Price/Quality Score

    Column 2:

    <span class="global-score s-10">
    <span class="score">9.4</span><span class="title">Price/Quality <br>Score</span></span>

    Column 3:

    <span class="global-score s-10">
    <span class="score">9.7</span><span class="title">Price/Quality <br>Score</span></span>

    Column 4:

    <span class="global-score s-10">
    <span class="score">9.9</span><span class="title">Price/Quality <br>Score</span></span>

    6th row:

    Column 1 has text color set to rgba(167, 167, 177, 1): Design Score

    Column 2:

    <span class="average"><span class="score">8.7</span><span class="round-icon s-9"><svg id="feat_size" class="display-icon" width="12" height="12" viewBox="0 0 12 12">
    <path fill-rule="evenodd" d="M14,187 L18,187 C19.1045695,187 20,187.895431 20,189 L20,197 C20,198.104569 19.1045695,199 18,199 L14,199 C12.8954305,199 12,198.104569 12,197 L12,189 C12,187.895431 12.8954305,187 14,187 Z M13,189 L13,197 L19,197 L19,189 L13,189 Z M23,187 C23.5522847,187 24,187.447715 24,188 L24,198 C24,198.552285 23.5522847,199 23,199 C22.4477153,199 22,198.552285 22,198 L22,188 C22,187.447715 22.4477153,187 23,187 Z" transform="translate(-12 -187)"></path> </svg></span></span><span class="title">Design</span>

    Column 3:

    <span class="average"><span class="score">9.2</span><span class="round-icon s-9"><svg id="feat_size" class="display-icon" width="12" height="12" viewBox="0 0 12 12">
    <path fill-rule="evenodd" d="M14,187 L18,187 C19.1045695,187 20,187.895431 20,189 L20,197 C20,198.104569 19.1045695,199 18,199 L14,199 C12.8954305,199 12,198.104569 12,197 L12,189 C12,187.895431 12.8954305,187 14,187 Z M13,189 L13,197 L19,197 L19,189 L13,189 Z M23,187 C23.5522847,187 24,187.447715 24,188 L24,198 C24,198.552285 23.5522847,199 23,199 C22.4477153,199 22,198.552285 22,198 L22,188 C22,187.447715 22.4477153,187 23,187 Z" transform="translate(-12 -187)"></path> </svg></span></span><span class="title">Design</span>

    Column 4:

    <span class="average"><span class="score">9.0</span><span class="round-icon s-9"><svg id="feat_size" class="display-icon" width="12" height="12" viewBox="0 0 12 12">
    <path fill-rule="evenodd" d="M14,187 L18,187 C19.1045695,187 20,187.895431 20,189 L20,197 C20,198.104569 19.1045695,199 18,199 L14,199 C12.8954305,199 12,198.104569 12,197 L12,189 C12,187.895431 12.8954305,187 14,187 Z M13,189 L13,197 L19,197 L19,189 L13,189 Z M23,187 C23.5522847,187 24,187.447715 24,188 L24,198 C24,198.552285 23.5522847,199 23,199 C22.4477153,199 22,198.552285 22,198 L22,188 C22,187.447715 22.4477153,187 23,187 Z" transform="translate(-12 -187)"></path> </svg></span></span><span class="title">Design</span>

    7th row:

    Column 1 has text color set to rgba(167, 167, 177, 1): Performance Score

    Column 2:

    <span class="average"><span class="score">8.4</span><span class="round-icon s-8"><svg id="feat_soc" class="display-icon" width="12" height="12" viewBox="0 0 12 12">
    <path fill-rule="evenodd" d="M23,20 L23.5,20 C23.7761424,20 24,20.2238576 24,20.5 L24,21.5 C24,21.7761424 23.7761424,22 23.5,22 L23,22 C23,23.1045695 22.1045695,24 21,24 L21,24.5 C21,24.7761424 20.7761424,25 20.5,25 L19.5,25 C19.2238576,25 19,24.7761424 19,24.5 L19,24 L17,24 L17,24.5 C17,24.7761424 16.7761424,25 16.5,25 L15.5,25 C15.2238576,25 15,24.7761424 15,24.5 L15,24 C13.8954305,24 13,23.1045695 13,22 L12.5,22 C12.2238576,22 12,21.7761424 12,21.5 L12,20.5 C12,20.2238576 12.2238576,20 12.5,20 L13,20 L13,18 L12.5,18 C12.2238576,18 12,17.7761424 12,17.5 L12,16.5 C12,16.2238576 12.2238576,16 12.5,16 L13,16 C13,14.8954305 13.8954305,14 15,14 L15,13.5 C15,13.2238576 15.2238576,13 15.5,13 L16.5,13 C16.7761424,13 17,13.2238576 17,13.5 L17,14 L19,14 L19,13.5 C19,13.2238576 19.2238576,13 19.5,13 L20.5,13 C20.7761424,13 21,13.2238576 21,13.5 L21,14 C22.1045695,14 23,14.8954305 23,16 L23.5,16 C23.7761424,16 24,16.2238576 24,16.5 L24,17.5 C24,17.7761424 23.7761424,18 23.5,18 L23,18 L23,20 Z M22,21.5 L22,20.5 L22,17.5 L22,16.5 L22,16 C22,15.4477153 21.5522847,15 21,15 L20.5,15 L19.5,15 L16.5,15 L15.5,15 L15,15 C14.4477153,15 14,15.4477153 14,16 L14,16.5 L14,17.5 L14,20.5 L14,21.5 L14,22 C14,22.5522847 14.4477153,23 15,23 L15.5,23 L16.5,23 L19.5,23 L20.5,23 L21,23 C21.5522847,23 22,22.5522847 22,22 L22,21.5 Z M17,17 L19,17 C19.5522847,17 20,17.4477153 20,18 L20,20 C20,20.5522847 19.5522847,21 19,21 L17,21 C16.4477153,21 16,20.5522847 16,20 L16,18 C16,17.4477153 16.4477153,17 17,17 Z" transform="translate(-12 -13)"></path> </svg></span></span><span class="title">Performance</span>

    Column 3:

    <span class="average"><span class="score">8.6</span><span class="round-icon s-8"><svg id="feat_soc" class="display-icon" width="12" height="12" viewBox="0 0 12 12">
    <path fill-rule="evenodd" d="M23,20 L23.5,20 C23.7761424,20 24,20.2238576 24,20.5 L24,21.5 C24,21.7761424 23.7761424,22 23.5,22 L23,22 C23,23.1045695 22.1045695,24 21,24 L21,24.5 C21,24.7761424 20.7761424,25 20.5,25 L19.5,25 C19.2238576,25 19,24.7761424 19,24.5 L19,24 L17,24 L17,24.5 C17,24.7761424 16.7761424,25 16.5,25 L15.5,25 C15.2238576,25 15,24.7761424 15,24.5 L15,24 C13.8954305,24 13,23.1045695 13,22 L12.5,22 C12.2238576,22 12,21.7761424 12,21.5 L12,20.5 C12,20.2238576 12.2238576,20 12.5,20 L13,20 L13,18 L12.5,18 C12.2238576,18 12,17.7761424 12,17.5 L12,16.5 C12,16.2238576 12.2238576,16 12.5,16 L13,16 C13,14.8954305 13.8954305,14 15,14 L15,13.5 C15,13.2238576 15.2238576,13 15.5,13 L16.5,13 C16.7761424,13 17,13.2238576 17,13.5 L17,14 L19,14 L19,13.5 C19,13.2238576 19.2238576,13 19.5,13 L20.5,13 C20.7761424,13 21,13.2238576 21,13.5 L21,14 C22.1045695,14 23,14.8954305 23,16 L23.5,16 C23.7761424,16 24,16.2238576 24,16.5 L24,17.5 C24,17.7761424 23.7761424,18 23.5,18 L23,18 L23,20 Z M22,21.5 L22,20.5 L22,17.5 L22,16.5 L22,16 C22,15.4477153 21.5522847,15 21,15 L20.5,15 L19.5,15 L16.5,15 L15.5,15 L15,15 C14.4477153,15 14,15.4477153 14,16 L14,16.5 L14,17.5 L14,20.5 L14,21.5 L14,22 C14,22.5522847 14.4477153,23 15,23 L15.5,23 L16.5,23 L19.5,23 L20.5,23 L21,23 C21.5522847,23 22,22.5522847 22,22 L22,21.5 Z M17,17 L19,17 C19.5522847,17 20,17.4477153 20,18 L20,20 C20,20.5522847 19.5522847,21 19,21 L17,21 C16.4477153,21 16,20.5522847 16,20 L16,18 C16,17.4477153 16.4477153,17 17,17 Z" transform="translate(-12 -13)"></path> </svg></span></span><span class="title">Performance</span>

    Column 4:

    <span class="average"><span class="score">8.6</span><span class="round-icon s-8"><svg id="feat_soc" class="display-icon" width="12" height="12" viewBox="0 0 12 12">
    <path fill-rule="evenodd" d="M23,20 L23.5,20 C23.7761424,20 24,20.2238576 24,20.5 L24,21.5 C24,21.7761424 23.7761424,22 23.5,22 L23,22 C23,23.1045695 22.1045695,24 21,24 L21,24.5 C21,24.7761424 20.7761424,25 20.5,25 L19.5,25 C19.2238576,25 19,24.7761424 19,24.5 L19,24 L17,24 L17,24.5 C17,24.7761424 16.7761424,25 16.5,25 L15.5,25 C15.2238576,25 15,24.7761424 15,24.5 L15,24 C13.8954305,24 13,23.1045695 13,22 L12.5,22 C12.2238576,22 12,21.7761424 12,21.5 L12,20.5 C12,20.2238576 12.2238576,20 12.5,20 L13,20 L13,18 L12.5,18 C12.2238576,18 12,17.7761424 12,17.5 L12,16.5 C12,16.2238576 12.2238576,16 12.5,16 L13,16 C13,14.8954305 13.8954305,14 15,14 L15,13.5 C15,13.2238576 15.2238576,13 15.5,13 L16.5,13 C16.7761424,13 17,13.2238576 17,13.5 L17,14 L19,14 L19,13.5 C19,13.2238576 19.2238576,13 19.5,13 L20.5,13 C20.7761424,13 21,13.2238576 21,13.5 L21,14 C22.1045695,14 23,14.8954305 23,16 L23.5,16 C23.7761424,16 24,16.2238576 24,16.5 L24,17.5 C24,17.7761424 23.7761424,18 23.5,18 L23,18 L23,20 Z M22,21.5 L22,20.5 L22,17.5 L22,16.5 L22,16 C22,15.4477153 21.5522847,15 21,15 L20.5,15 L19.5,15 L16.5,15 L15.5,15 L15,15 C14.4477153,15 14,15.4477153 14,16 L14,16.5 L14,17.5 L14,20.5 L14,21.5 L14,22 C14,22.5522847 14.4477153,23 15,23 L15.5,23 L16.5,23 L19.5,23 L20.5,23 L21,23 C21.5522847,23 22,22.5522847 22,22 L22,21.5 Z M17,17 L19,17 C19.5522847,17 20,17.4477153 20,18 L20,20 C20,20.5522847 19.5522847,21 19,21 L17,21 C16.4477153,21 16,20.5522847 16,20 L16,18 C16,17.4477153 16.4477153,17 17,17 Z" transform="translate(-12 -13)"></path> </svg></span></span><span class="title">Performance</span>

    8th row:

    Column 1 has text color set to rgba(167, 167, 177, 1): Camera Score

    Column 2:

    <span class="average"><span class="score">9.5</span><span class="round-icon s-10"><svg id="feat_camera" width="14" height="12" class="display-icon" viewBox="0 0 14 12">
    <path fill-rule="evenodd" d="M17,101 L22,101 C23.6568542,101 25,102.343146 25,104 L25,108 C25,109.656854 23.6568542,111 22,111 L14,111 C12.3431458,111 11,109.656854 11,108 L11,104 C11,102.343146 12.3431458,101 14,101 C14,100.447715 14.4477153,100 15,100 L16,100 C16.5522847,100 17,100.447715 17,101 Z M16,102 C14.8954305,102 14,102.895431 14,104 L14,108 C14,109.104569 14.8954305,110 16,110 L22,110 C23.1045695,110 24,109.104569 24,108 L24,104 C24,102.895431 23.1045695,102 22,102 L16,102 Z M19,109 C17.3431458,109 16,107.656854 16,106 C16,104.343146 17.3431458,103 19,103 C20.6568542,103 22,104.343146 22,106 C22,107.656854 20.6568542,109 19,109 Z M19,108 C20.1045695,108 21,107.104569 21,106 C21,104.895431 20.1045695,104 19,104 C17.8954305,104 17,104.895431 17,106 C17,107.104569 17.8954305,108 19,108 Z" transform="translate(-11 -100)"></path> </svg></span></span><span class="title">Camera</span>

    Column 3:

    <span class="average"><span class="score">9.1</span><span class="round-icon s-10"><svg id="feat_camera" width="14" height="12" class="display-icon" viewBox="0 0 14 12">
    <path fill-rule="evenodd" d="M17,101 L22,101 C23.6568542,101 25,102.343146 25,104 L25,108 C25,109.656854 23.6568542,111 22,111 L14,111 C12.3431458,111 11,109.656854 11,108 L11,104 C11,102.343146 12.3431458,101 14,101 C14,100.447715 14.4477153,100 15,100 L16,100 C16.5522847,100 17,100.447715 17,101 Z M16,102 C14.8954305,102 14,102.895431 14,104 L14,108 C14,109.104569 14.8954305,110 16,110 L22,110 C23.1045695,110 24,109.104569 24,108 L24,104 C24,102.895431 23.1045695,102 22,102 L16,102 Z M19,109 C17.3431458,109 16,107.656854 16,106 C16,104.343146 17.3431458,103 19,103 C20.6568542,103 22,104.343146 22,106 C22,107.656854 20.6568542,109 19,109 Z M19,108 C20.1045695,108 21,107.104569 21,106 C21,104.895431 20.1045695,104 19,104 C17.8954305,104 17,104.895431 17,106 C17,107.104569 17.8954305,108 19,108 Z" transform="translate(-11 -100)"></path> </svg></span></span><span class="title">Camera</span>

    Column 4:

    <span class="average"><span class="score">8.8</span><span class="round-icon s-10"><svg id="feat_camera" width="14" height="12" class="display-icon" viewBox="0 0 14 12">
    <path fill-rule="evenodd" d="M17,101 L22,101 C23.6568542,101 25,102.343146 25,104 L25,108 C25,109.656854 23.6568542,111 22,111 L14,111 C12.3431458,111 11,109.656854 11,108 L11,104 C11,102.343146 12.3431458,101 14,101 C14,100.447715 14.4477153,100 15,100 L16,100 C16.5522847,100 17,100.447715 17,101 Z M16,102 C14.8954305,102 14,102.895431 14,104 L14,108 C14,109.104569 14.8954305,110 16,110 L22,110 C23.1045695,110 24,109.104569 24,108 L24,104 C24,102.895431 23.1045695,102 22,102 L16,102 Z M19,109 C17.3431458,109 16,107.656854 16,106 C16,104.343146 17.3431458,103 19,103 C20.6568542,103 22,104.343146 22,106 C22,107.656854 20.6568542,109 19,109 Z M19,108 C20.1045695,108 21,107.104569 21,106 C21,104.895431 20.1045695,104 19,104 C17.8954305,104 17,104.895431 17,106 C17,107.104569 17.8954305,108 19,108 Z" transform="translate(-11 -100)"></path> </svg></span></span><span class="title">Camera</span>

    9th row:

    Column 1 has text color set to rgba(167, 167, 177, 1): Battery Score

    Column 2:

    <span class="average"><span class="score">7.0</span><span class="round-icon s-7"><svg id="feat_battery" class="display-icon" weight="14" height="8" viewBox="0 0 14 8">
    <path fill-rule="evenodd" d="M24,76 L25,76 L25,78 L24,78 L24,79 C24,80.1045695 23.1045695,81 22,81 L13,81 C11.8954305,81 11,80.1045695 11,79 L11,75 C11,73.8954305 11.8954305,73 13,73 L22,73 C23.1045695,73 24,73.8954305 24,75 L24,76 Z M13,74 C12.4477153,74 12,74.4477153 12,75 L12,79 C12,79.5522847 12.4477153,80 13,80 L22,80 C22.5522847,80 23,79.5522847 23,79 L23,75 C23,74.4477153 22.5522847,74 22,74 L13,74 Z M13,75 L19,75 L19,79 L13,79 L13,75 Z" transform="translate(-11 -73)"></path> </svg></span></span><span class="title">Battery</span>

    Column 3:

    <span class="average"><span class="score">8.4</span><span class="round-icon s-7"><svg id="feat_battery" class="display-icon" weight="14" height="8" viewBox="0 0 14 8">
    <path fill-rule="evenodd" d="M24,76 L25,76 L25,78 L24,78 L24,79 C24,80.1045695 23.1045695,81 22,81 L13,81 C11.8954305,81 11,80.1045695 11,79 L11,75 C11,73.8954305 11.8954305,73 13,73 L22,73 C23.1045695,73 24,73.8954305 24,75 L24,76 Z M13,74 C12.4477153,74 12,74.4477153 12,75 L12,79 C12,79.5522847 12.4477153,80 13,80 L22,80 C22.5522847,80 23,79.5522847 23,79 L23,75 C23,74.4477153 22.5522847,74 22,74 L13,74 Z M13,75 L19,75 L19,79 L13,79 L13,75 Z" transform="translate(-11 -73)"></path> </svg></span></span><span class="title">Battery</span>

    Column 4:

    <span class="average"><span class="score">7.7</span><span class="round-icon s-7"><svg id="feat_battery" class="display-icon" weight="14" height="8" viewBox="0 0 14 8">
    <path fill-rule="evenodd" d="M24,76 L25,76 L25,78 L24,78 L24,79 C24,80.1045695 23.1045695,81 22,81 L13,81 C11.8954305,81 11,80.1045695 11,79 L11,75 C11,73.8954305 11.8954305,73 13,73 L22,73 C23.1045695,73 24,73.8954305 24,75 L24,76 Z M13,74 C12.4477153,74 12,74.4477153 12,75 L12,79 C12,79.5522847 12.4477153,80 13,80 L22,80 C22.5522847,80 23,79.5522847 23,79 L23,75 C23,74.4477153 22.5522847,74 22,74 L13,74 Z M13,75 L19,75 L19,79 L13,79 L13,75 Z" transform="translate(-11 -73)"></path> </svg></span></span><span class="title">Battery</span>

    10th row:

    Column 1:

    <span class="h">User reviews</span>

    Colums 2, 3, and 4 are blank.

    11th row:

    Column 1 has text color set to rgba(167, 167, 177, 1): User Score

    Column 2:

    <div class="global-user-score">
    <div class="score">9.9</div><div class="number-opinions">19 reviews</div></div>

    Column 3:

    <div class="global-user-score">
    <div class="score">7.8</div><div class="number-opinions">24 reviews</div></div>

    Column 4:

    <div class="global-user-score">
    <div class="score">9.1</div><div class="number-opinions">48 reviews</div></div>

    12th row:

    Column 1:

    <span class="h">Screen</span>

    Colums 2, 3, and 4 are blank.

    Rows 13 - 16 all contain simple text.

    13th row:

    Column 1 has text color set to rgba(167, 167, 177, 1): Inches

    Column 2: 6.58"

    Column 3: 6.9"

    Column 4: 6.67"

    14th row:

    Column 1 has text color set to rgba(167, 167, 177, 1): Resolution

    Column 2: FHD+

    Column 3: WQHD+

    Column 4: FHD+

    15th row:

    Column 1 has text color set to rgba(167, 167, 177, 1): Usable surface

    Column 2: 92% useful

    Column 3: 90% useful

    Column 4: 89% useful

    16th row:

    Column 1 has text color set to rgba(167, 167, 177, 1): Aspect ratio

    Column 2: 20:9

    Column 3: 20:9

    Column 4: 19.5:9

    17th row:

    Column 1:

    <span class="h">Structure</span>

    Colums 2, 3, and 4 are blank.

    18th row:

    Column 1 has text color set to rgba(167, 167, 177, 1): Dimensions

    Column 2:

    72.6 mm <br>
    158.2 mm <br>9.0 mm

    Column 3:

    76.0 mm <br>
    166.9 mm <br>8.8 mm

    Column 4:

    74.8 mm<br>
    162.6 mm<br>9.0 mm

    19th row:

    Column 1 has text color set to rgba(167, 167, 177, 1): Weight

    Column 2: 209 g

    Column 3: 222 g

    Column 4: 208 g

    20th row:

    Column 1:

    <span class="h">Performance</span>

    Colums 2, 3, and 4 are blank.

    21st row:

    Column 1 has text color set to rgba(167, 167, 177, 1): Micro

    Column 2: Kirin 990 Octa-Core

    Column 3: Exynos 990 Octa-Core

    Column 4: SnapD. 865 Octa-Core

    22nd row:

    Column 1 has text color set to rgba(167, 167, 177, 1): RAM

    Column 2: 8 GB RAM

    Column 3: 12 GB RAM

    Column 4: 8 GB RAM

    23rd row:

    Column 1 has text color set to rgba(167, 167, 177, 1): Storage

    Column 2: 256 GB

    Column 3: 128 GB

    Column 4: 256 GB

    24th row:

    Column 1 has text color set to rgba(167, 167, 177, 1): SD Slot

    Column 2:

    <img src="https://wpdatatables.com/wp-content/uploads/2021/07/icon-yes.png" class=" aligncenter size-thumbnail" width="20" height="20"" />

    Column 3:

    <img src="https://wpdatatables.com/wp-content/uploads/2021/07/icon-yes.png" class=" aligncenter size-thumbnail" width="20" height="20"" />

    Column 4:

    <img src="https://wpdatatables.com/wp-content/uploads/2021/07/icon-no.png" class=" aligncenter size-thumbnail" width="20" height="20"" />

    Rows 25 - 28 all contain simple text.

    25th row:

    Column 1 has text color set to rgba(167, 167, 177, 1): Battery

    Column 2: 4200 mAh

    Column 3: 5000 mAh

    Column 4: 4780 mAh

    26th row:

    Column 1 has text color set to rgba(167, 167, 177, 1): Main Camera

    Column 2: 52 Mpx

    Column 3: 108 Mpx

    Column 4: 108 Mpx

    27th row:

    Column 1 has text color set to rgba(167, 167, 177, 1): Selfie Camera

    Column 2: SELF 32 Mpx

    Column 3: SELF 40 Mpx

    Column 4: SELF 20 Mpx

    27th row:

    Column 1 has text color set to rgba(167, 167, 177, 1): OS

    Column 2: Android 10 Q

    Column 3: Android 11 Red Velvet Cake

    Column 4: Android 10 Q

    29th row:

    Column 1 has text color set to rgba(167, 167, 177, 1): More info

    Column 2:

    <a href="https://www.amazon.com/dp/B086FFFGJL?tag=gsmarena093-20&linkCode=osi&th=1&psc=1" target="_blank"><img data-media-content="wpdt-media-content" src="https://wpdatatables.com/wp-content/uploads/2021/07/Screenshot-from-2021-06-29-10-53-24.png" class=" aligncenter size-full" width="128" height="64" /></a>

    Column 3:

    <a href="https://www.amazon.com/Samsung-Unlocked-Smartphone-Pro-Grade-Lavender/dp/B08FYTRF6J/ref=sr_1_2_sspa?crid=75BPC49WFO16&dchild=1&keywords=samsung+galaxy+s20+ultra+5g&qid=1624955033&sprefix=Samsung+Galaxy+S20+Ultra%2Caps%2C281&sr=8-2-spons&psc=1&spLa=ZW5jcnlwdGVkUXVhbGlmaWVyPUEzOTBGTVQ2WDkxQ1YxJmVuY3J5cHRlZElkPUEwOTMzODYzWFdWVzBaOU05MzIzJmVuY3J5cHRlZEFkSWQ9QTA5NzkyNTkxVlM5T1VZMTBQN1hIJndpZGdldE5hbWU9c3BfYXRmJmFjdGlvbj1jbGlja1JlZGlyZWN0JmRvTm90TG9nQ2xpY2s9dHJ1ZQ==" target="_blank"><img data-media-content="wpdt-media-content" src="https://wpdatatables.com/wp-content/uploads/2021/07/Screenshot-from-2021-06-29-10-53-24.png" class=" aligncenter size-full" width="128" height="64" /></a>

    Column 4:

    <a href="https://www.amazon.com/Xiaomi-Note-10-Lite-International/dp/B0887V5WZ6/ref=sr_1_4?dchild=1&keywords=Xiaomi+Mi+10&qid=1624954920&sr=8-4" target="_blank"><img data-media-content="wpdt-media-content" src="https://wpdatatables.com/wp-content/uploads/2021/07/Screenshot-from-2021-06-29-10-53-24.png" class=" aligncenter size-full" width="128" height="64" /></a>

    That completes the table construction in the back-end, so now just click on "Save Changes" in the top right, and add the table to one of your front-end pages either by using its shortcode, or by using one of the supported builders' blocks.

    When you add the table on the page, you'll see a plain table (a simple table) that doesn't resemble the table you see in our documentation.

    In order to apply all the styles you see there, you need to copy and paste the following CSS, but please keep in mind that you need to change all references to the table ID, so it matches the ID of your table.

    The ID you'll have to change is: "wpdtSimpleTable-171".

    We suggest you copy the following CSS and paste it into a text editor where you can Find All/Replace All so find all instances of "wpdtSimpleTable-171" and replace them with the ID of your table (for example "wpdtSimpleTable-10").

    Custom CSS:

    .wdt-white-background {
    background: #FFF;
    padding-top: 30px;
    }
    .vc_tta-tab>a {
    background-color: #091D70 !important;
    color: #FFFFFF !important;
    }
    .vc_tta-tab>a:hover,.vc_tta-tab.vc_active>a {
    background-color: #FFFFFF !important;
    color: #091D70 !important;
    }
    
    #wpdtSimpleTable-171 td .global-score.s-10 {
    background-color: #07ce7d;
    }
    
    #wpdtSimpleTable-171 td .global-score {
    display: inline-block;
    vertical-align: top;
    padding: 6px 12px;
    margin-bottom: 6px;
    border-radius: 12px;
    }
    
    #wpdtSimpleTable-171 td .global-score .score {
    display: inline-block;
    vertical-align: top;
    line-height: .9;
    font-size: 30px;
    font-weight: 700;
    color: #fff;
    min-width: 48px;
    }
    
    #wpdtSimpleTable-171 td .global-score .title {
    display: inline-block !important;
    vertical-align: top;
    margin-left: 6px;
    font-size: 12px;
    line-height: 1.2;
    font-weight: 700;
    color: #fff;
    }
    
    #wpdtSimpleTable-171 td .average {
    margin-left: 7%;
    }
    
    #wpdtSimpleTable-171 td .average .score {
    line-height: 1;
    min-width: 32px;
    }
    
    #wpdtSimpleTable-171 td .average .score {
    font-size: 20px;
    line-height: .8;
    font-weight: 700;
    display: -moz-inline-stack;
    display: inline-block;
    }
    
    #wpdtSimpleTable-171 td .average .round-icon {
    margin: -7px 4px -1px 8px;
    }
    
    #wpdtSimpleTable-171 td .average .round-icon.s-10 {
    background: #08e58b;
    }
    
    #wpdtSimpleTable-171 td .average .round-icon.s-9 {
    background: #41ea67;
    }
    
    #wpdtSimpleTable-171 td .average .round-icon.s-8 {
    background: #76ef53;
    }
    
    #wpdtSimpleTable-171 td .average .round-icon.s-7 {
    background: #a8f340;
    }
    
    #wpdtSimpleTable-171 td .round-icon {
    display: -moz-inline-stack;
    display: inline-block;
    zoom: 1;
    vertical-align: middle;
    text-align: center;
    width: 22px;
    height: 22px;
    border-radius: 50%;
    background: #4f4e56;
    }
    
    #wpdtSimpleTable-171 td .display-icon {
    fill: #fff;
    margin-top: 5px;
    }
    
    #wpdtSimpleTable-171 td .average + .title {
    vertical-align: middle;
    display: inline-block;
    margin-top: -5px;
    }
    
    #wpdtSimpleTable-171 td .title {
    font-size: 12px;
    color: #a7a7b1;
    }
    
    #wpdtSimpleTable-171 td .global-user-score .score {
    display: inline-block;
    vertical-align: top;
    line-height: .9;
    font-size: 30px;
    font-weight: 700;
    color: #4f4e56;
    min-width: 48px;
    }
    
    #wpdtSimpleTable-171 td {
    font-size: 14px;;
    }
    
    #wpdtSimpleTable-171 td .h {
    box-shadow: inset 0 -7px #ffffa0;
    display: inline;
    font-size: 16px;
    font-weight: 600;
    color: #4f4e56;
    }
    
    #wpdtSimpleTable-171 td .price {
    
    font-size: 30px;
    font-weight: 600;
    color: #4f4e56;
    padding: 20px 0;
    display: inline-block;
    
    }
    
    #wpdtSimpleTable-171 tr:first-child td img {
    padding: 20px;
    }
    
    Permalink
    Was this answer helpful ?

    Yes No
    Viewed 11879 Times
  • 6. How to create the Pricing table example #1?
     

    All pricing tables shown on the Pricing examples page are Simple Tables. So, we'll start by creating a Simple Table with 5 columns and 6 rows.

    Before you start constructing this table, our advice is to access wpDataTables Settings/Custom JS and CSS tab and add the following CSS to the Custom CSS box, so all custom code is automatically applied while you're constructing the table.

    Also, please note that you will need to change the table ID in the CSS below, so it applies to the ID of the table you're creating. For example, if your table's ID is 17, you'll replace #wpdtSimpleTable-34 with #wpdtSimpleTable-17

    .checkmark {
        display: inline-block;
        transform: rotate(45deg);
        height: 16px;
        width: 10px;
        border-bottom: 7px solid #78b13f;
        border-right: 7px solid #78b13f;
    }
    
    .checkmark-blue {
        margin-left: 20px;
        border-bottom: 2px solid #091d70;
        border-right: 2px solid #091d70;
    }
    
    .checkmark-white {
        margin-left: 20px;
        border-bottom: 2px solid #FFFFFF;
        border-right: 2px solid #FFFFFF;
    }
    
    .wdt-white-background {
        background: #FFF;
        padding-top: 30px;
    }
    
    .vc_tta-tab>a {
        background-color: #091D70 !important;
        color: #FFFFFF !important;
    }
    
    .vc_tta-tab>a:hover,.vc_tta-tab.vc_active>a {
        background-color: #FFFFFF !important;
        color: #091D70 !important;
    }
    
    #wpdtSimpleTable-34 button.tryit {
        background-color: #4d8f44 !important;
        font-size: 20px;
    }
    
    #wpdtSimpleTable-34 button.tryit:hover {
        background-color: #256300 !important;
    }
    
    #wpdtSimpleTable-34 button.signup {
        background-color: #666666 !important;
        font-size: 20px;
    }
    
    #wpdtSimpleTable-34 button.signup:hover {
        background-color: #000000 !important;
    }
    
    #wpdtSimpleTable-34 tr:first-child td:first-child {
        border-left-color: #FFFFFF !important;
        border-top-color: #FFFFFF !important;
    }
    
    #wpdtSimpleTable-34 tr:first-child td {
        border: none !important;
    }
    
    #wpdtSimpleTable-34 tr:last-child td:first-child {
        border-left-color: #FFFFFF !important;
        border-bottom-color: #FFFFFF !important;
    }
    

    Column 1

    The 1st and the last cells of the 1st column are intentionally left blank while the remaining 4 cells in this column contain the following data:

    Row 2, Column 1:

    <span style="font-size: 16px;">Active projects</span>
    

    Row 3, Column 1:

    <span style="font-size: 16px;">File Storage</span>
    

    Row 4, Column 1:

    <span style="font-size: 16px;">Site Branding</span>
    

    Row 5, Column 1:

    <span style="font-size: 16px;">Users/Reviewers</span>
    

    Simply double-click on the cell and paste the content from the text block on the left:

    You can select these 4 cells now and click on the "Background Color" icon above the table.

    In there, in the RGBA cell, paste this:

    rgba(217, 217, 217, 1)

    Column 2

    Populate the 2nd column with the following data:

    Row 1, Column 2:

    <p style="text-align: center;margin-bottom:0;" data-type-content="wpdt-html-content"><span style="color: #ffffff;font-size:25px;">Trial</span></p>
    <div style="text-align: center;" data-type-content="wpdt-html-content"><span style="color: #ffffff;"><strong>Free</strong> for 30 days</span></div>
    

    Row 2, Column 2:

    <div data-type-content="wpdt-html-content" style="font-size:20px;"><strong>15</strong></div>
    

    Row 3, Column 2:

    1GB
    

    Row 4, Column 2:

    <div class="checkmark"></div>
    

    Row 5, Column 2:

    Unlimited
    

    Row 6, Column 2:

    <a class="wpdt-link-content" href="https://wpdatatables.com/pricing"  target="_blank"  data-cell-id="51" data-link-url="https://wpdatatables.com/pricing" data-link-text="Try it!" data-link-target="true" data-link-nofollow="0" data-link-btn-status="true" data-link-btn-class="tryit" data-link-content="wpdt-link-content"><button class="tryit">Try it!</button></a>
    

    The Background Color of the 1st cell in the 2nd column is:

    rgba(37, 99, 0, 1)

    The Background Colors of cells 2, 3, 4, and 5 are:

    rgba(221, 239, 217, 1)

    Column 3

    Row 1, Column 3:

    <p style="text-align: center; margin-bottom: 0;" data-type-content="wpdt-html-content"><span style="color: #ffffff; font-size: 25px;">Business</span></p>
    <div style="text-align: center;" data-type-content="wpdt-html-content"><span style="color: #ffffff;"><strong>$99</strong> per month</span></div>
    

    Row 2, Column 3:

    <div data-type-content="wpdt-html-content" style="font-size:20px;"><strong>35</strong></div>
    

    Row 3, Column 3:

    5GB

    Row 4, Column 3:

    <div class="checkmark"></div>
    

    Row 5, Column 3:

    Unlimited

    Row 6, Column 3:

    <a class="wpdt-link-content" href="https://wpdatatables.com/pricing"  target="_blank"  data-cell-id="52" data-link-url="https://wpdatatables.com/pricing" data-link-text="Sign up" data-link-target="true" data-link-nofollow="0" data-link-btn-status="true" data-link-btn-class="signup" data-link-content="wpdt-link-content"><button class="signup">Sign up</button></a>
    

    The Background Color of the 1st cell in the 3rd column is:

    rgba(0, 0, 0, 1)

    The Background Colors of cells 2, 3, 4, and 5 are:

    rgba(241, 241, 241, 1)

    Column 4

    Row 1, Column 4:

    <p style="text-align: center; margin-bottom: 0;" data-type-content="wpdt-html-content"><span style="color: #ffffff; font-size: 25px;">Team</span></p>
    <div style="text-align: center;" data-type-content="wpdt-html-content"><span style="color: #ffffff;"><strong>$49 per month</strong></span></div>
    

    Row 2, Column 4:

    <div data-type-content="wpdt-html-content" style="font-size:20px;"><strong>15</strong></div>
    

    Row 3, Column 4:

    2GB

    Row 4, Column 4:

    <div class="checkmark"></div>
    

    Row 5, Column 4:

    Unlimited

    Row 6, Column 4:

    <a class="wpdt-link-content" href="https://wpdatatables.com/pricing"  target="_blank"  data-cell-id="53" data-link-url="https://wpdatatables.com/pricing" data-link-text="Sign up" data-link-target="true" data-link-nofollow="0" data-link-btn-status="true" data-link-btn-class="signup" data-link-content="wpdt-link-content"><button class="signup">Sign up</button></a>
    

    The Background Color of the 1st cell in the 4th column is:

    rgba(0, 0, 0, 1)

    The Background Colors of cells 2, 3, 4, and 5 are:

    rgba(241, 241, 241, 1)

    Column 5

    Row 1, Column 5:

    <p style="text-align: center; margin-bottom: 0;" data-type-content="wpdt-html-content"><span style="color: #ffffff; font-size: 25px;">Solo</span></p>
    <div style="text-align: center;" data-type-content="wpdt-html-content"><span style="color: #ffffff;"><strong>$24</strong> per month</span></div>
    

    Row 2, Column 5:

    <div data-type-content="wpdt-html-content" style="font-size:20px;"><strong>5</strong></div>
    

    Row 3, Column 5:

    50MB

    Row 4, Column 5:

    - - -

    Row 5, Column 5:

    Unlimited

    Row 6, Column 5:

    <a class="wpdt-link-content" href="https://wpdatatables.com/pricing"  target="_blank"  data-cell-id="54" data-link-url="https://wpdatatables.com/pricing" data-link-text="Sign up" data-link-target="true" data-link-nofollow="0" data-link-btn-status="true" data-link-btn-class="signup" data-link-content="wpdt-link-content"><button class="signup">Sign up</button></a>
    

    The Background Color of the 1st cell in the 5th column is:

    rgba(0, 0, 0, 1)

    The Background Colors of cells 2, 3, 4, and 5 are:

    rgba(241, 241, 241, 1)

    That completes the configuration and data population for the Pricing Table example #1 from our documentation.

    The Display and the Responsive tabs above the table are configured like this:

    Permalink
    Was this answer helpful ?

    Yes No
    Viewed 8917 Times
  • 1. Can I make editable tables from Gravity forms with your Gravity integration add on?
     

    Yes you can. From Version 1.1, which is released 13.07.2018, Gravity integration for wpDataTables has:

          1.)    Server-side processing for large tables – if a gravity form has more than 3000-5000 entries, this feature allows to add lazy loading to the table.

          2.)   Front-end editing for Gravity Forms-based tables – using this feature you can edit the Gravity forms entries directly from wpDataTables (a standard Gravity editor will appear in a popup).

    Note: Please use with wpDataTables 2.2.3+ only!

    Permalink
    Was this answer helpful ?

    Yes No
    Viewed 15607 Times

Still no luck? We can help!


Contact us and we’ll get back to you as soon as possible.